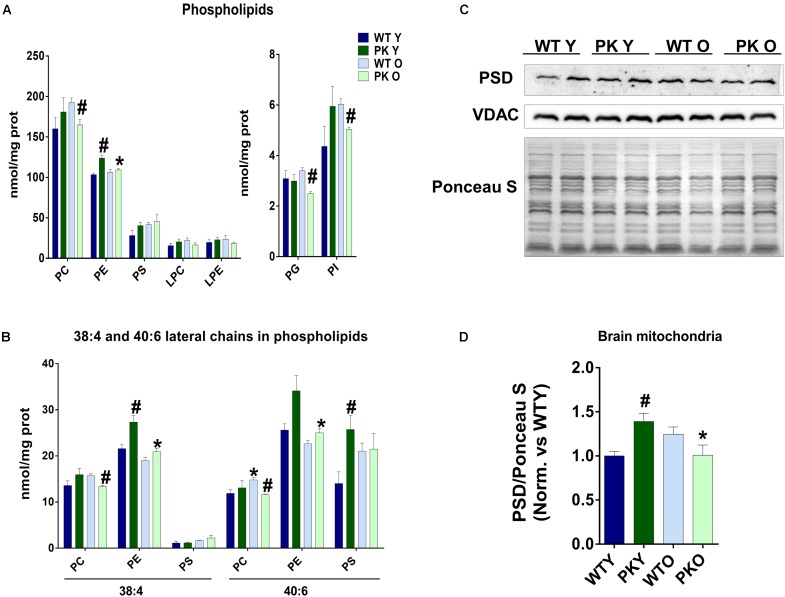
FIGURE 2.
PE levels change in PK-KO mice’s mitochondria due to PSD. (A) Levels of phospholipids (PC, PE, PS, LPC, LPE, PG, and PI) and changes due to aging and parkin loss. (B) Levels of phospholipids (PC, PE, and PS) containing arachidonic (20:4) or docosahexaenoic acid (22:6) as lateral chains. (C) Western-blot experiment showing PSD levels in brain’s mitochondria from WT and PK-KO mice. (D) Quantification of PSD intensity in brain’s mitochondria. Graphs represent the mean ± SEM. One Way ANOVA statistical analysis was performed. ∗p < 0.05 due to aging. #p < 0.05 due to parkin loss. n = 4 for lipidomic analysis and n = 6 for western-blot experiments.

