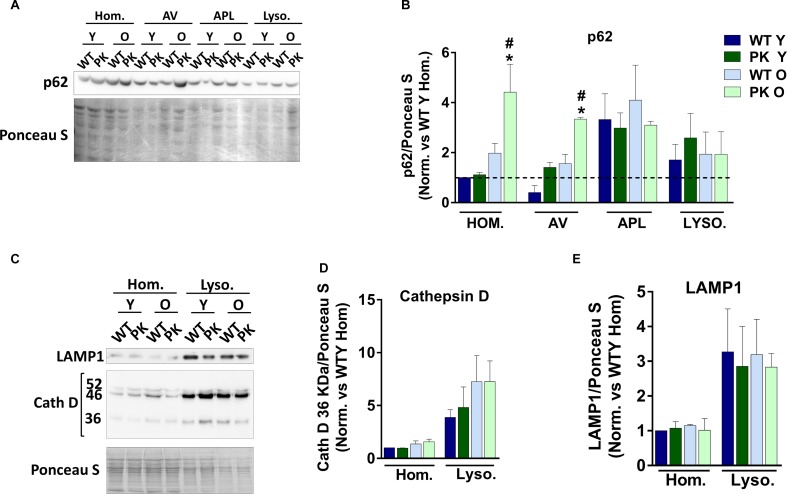
FIGURE 6.
Autophagy related markers in subcelluar fractions from brain and changes due to aging and parkin loss. p62 accumulates in PK-KO old mice autophagosomes but not in autophagolysosomes or lysosomes. (A) Representative image of a Western-Blot experiment showing p62 levels in the different subcellular fractions isolated. (B) Quantification of p62 intensity in brain’s subcellular fractions. (C) Western-Blot experiment showing LAMP1 and Cathepsin D levels in homogenates and lysosomes. (D) Quantification of Cath D 36 KDa in brain’s subcellular fractions. (E) Quantification of LAMP1 intensity in brain’s subcellular fractions. Graphs represent the mean ± SEM. Statistical analysis was performed by One Way ANOVA test. ∗p < 0.05 due to aging. #p < 0.05 due to Parkin loss. n = 3–5 preparations of three mice each.

