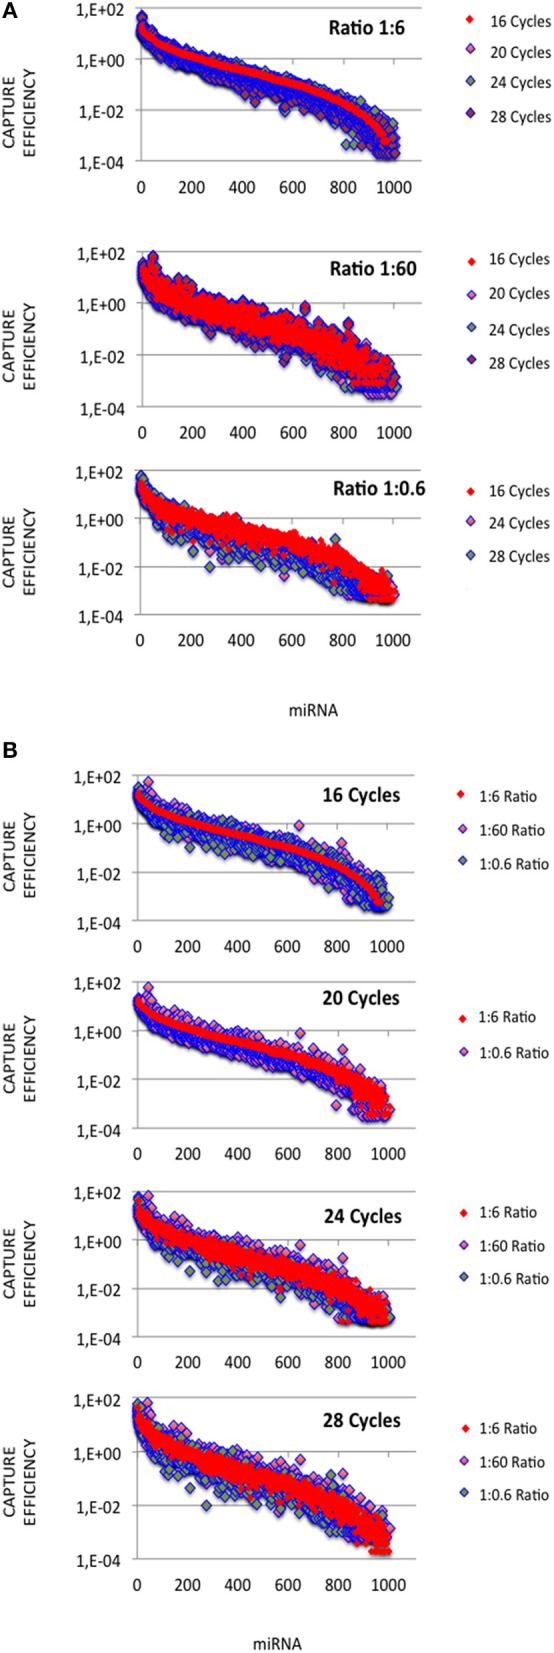
Figure 1.

miRNA capture efficiencies extend over a 105 amplitude range. cDNA libraries were built from equimolar miRNA amounts with ratios of miRNA:3′ adaptor of 1:0.6, 1:6 or 1:60, and 16, 20, 24, or 28 amplification cycles. For each miRNA:3′ adaptor ratio and each amplification cycle number, we quantified the efficiency of capture (EC) of each miRNA by dividing the miRNA expression frequency (i.e., miRNA reads/sum of miRNA reads) by the miRNA abundance in the sample (i.e., 1/1006). ECs are plotted for different miRNA:3′ adaptor ratios (A) or different amplification cycle numbers (B). miRNAs were identically ordered on the X-axes of the plots of (A,B). This order was obtained by sorting ECs calculated from the expression profile established when using the miRNA:3′ adaptor ratio of 1:6 and 16 amplification cycles (see Supplemental Table S3). Y-axes are drawn using a log10 scale. Note that the values of ECs largely overlap in each plot.
