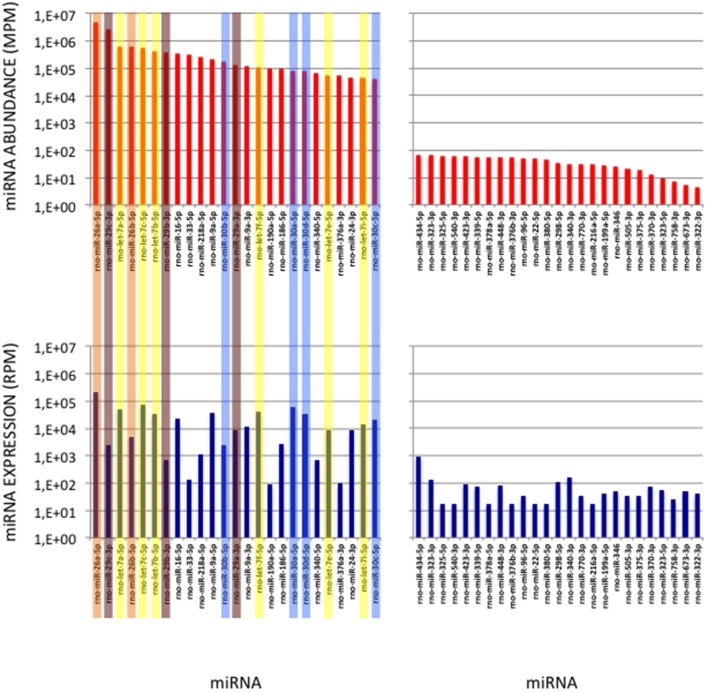
Figure 7.
miRNAs of High Abundance in the Cerebellum Sample. (Upper Graphs) Abundances of the first and last 25 miRNAs in the cerebellum sample are shown, ordered by decreasing values. All 5p-members of the miR-26 and miR-29 families appear highly abundant (ranks < rank 14). Data are expressed in Molecules per Million (MPM). (Lower Graphs) Corresponding expressions in the cerebellum expression profile. Data are expressed in Reads per Million (RPM). miRNAs are ordered as in the upper graphs. Members of the let-7, miR-26, miR-29 and miR-30 families are pictured in yellow, orange, purple and blue, respectively.

