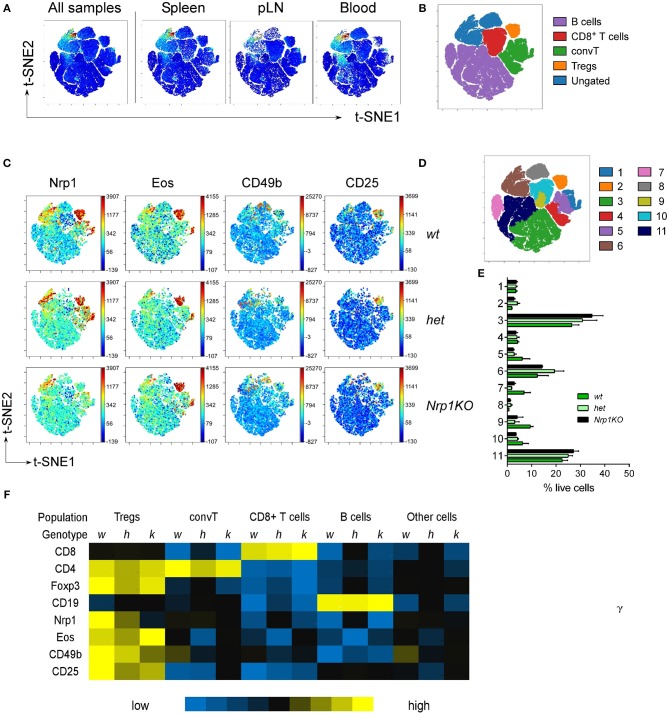
Figure 2.
Disruption of Nrp1 expression on Treg cells does not interfere with the acquisition of modulatory molecules. Organs and tissues were collected and processed as in Figure 1. viSNE analysis was run on 10,000 live single cells per sample using cell subtype markers. (A) Representative viSNE map of concatenated files of all samples, and concatenated individual populations from pLN, Spl, and blood samples. (B) viSNE map showing color-coded cell populations based on lineage marker expression gating. (C) Fluorescence intensity for specific markers from wt, het, and Nrp1KO spleen cells on viSNE map. (D) SPADE-on-viSNE map defining 11 spatially distinct splenic cell populations. (E) Relative proportions of immune cell populations defined in (D) from splenocytes. (F) MFI heat map of surface and intracellular markers expression on each immune cell subpopulation from splenic Treg-restricted wt (w), het (h), and Nrp1KO (k) mice. Representative data of at least three independent experiments.

