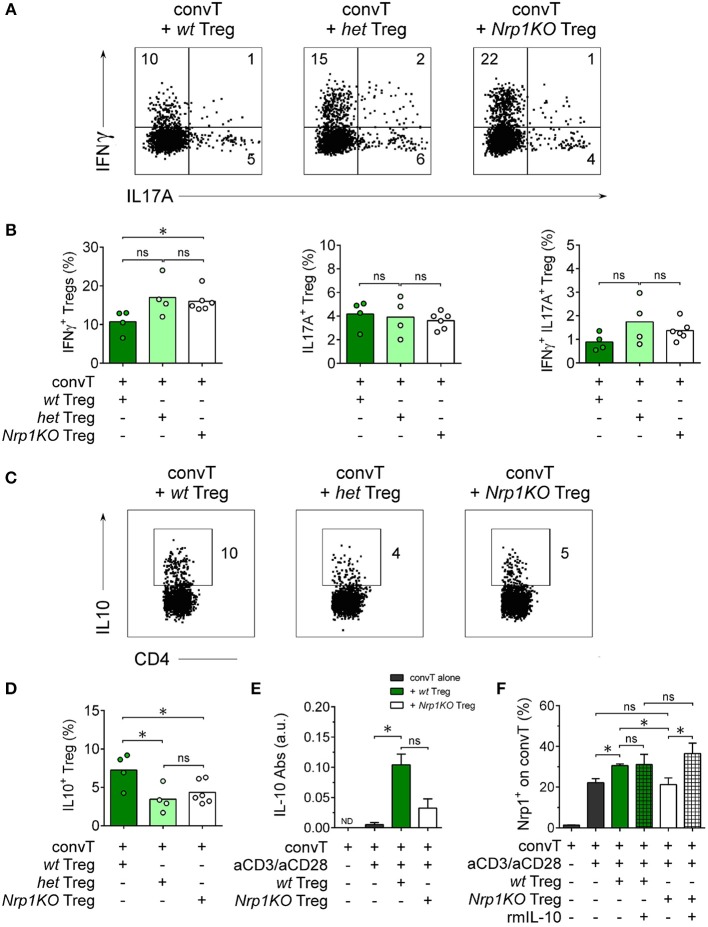
Figure 6.
Nrp1 controls IFNγ and IL-10 production by Treg cells. Mice were transplanted as described in Figure 4 and cells processed as in Figure 5. Representative dot plots (A) and bar graphs (B) showing the expression of IFNγ and IL17 on wt (dark green), het (light green), or Nrp1KO (white) Treg cells. Representative dot plots (C) and bar graphs (D) depicting the expression of IL-10 on wt, het, or Nrp1KO Treg cells. (E) Responder convT cells and Foxp3+ Treg cells were sorted and treated as described in Figure 3. After 72 h, secreted IL-10 was measured in the supernatant of convT cells cultured alone or with Treg from wt or Nrp1KO mice by ELISA. (F) Pooled data depicting Nrp1 expression on CD45.1+ convT cells cultured with Treg cells from the two indicated genotypes, alone or plus recombinant murine IL-10 (rmIL-10). For (B,C), bars represent mean and each circle represents one mouse. Unpaired T-test, * < 0.05; ns, not significant. Pooled data of at least two independent experiments. For (E,F), bars represent mean ± SEM. Paired t-Test, * < 0.05; ns, not significant. Pooled data of two independent experiments performed in triplicates.

