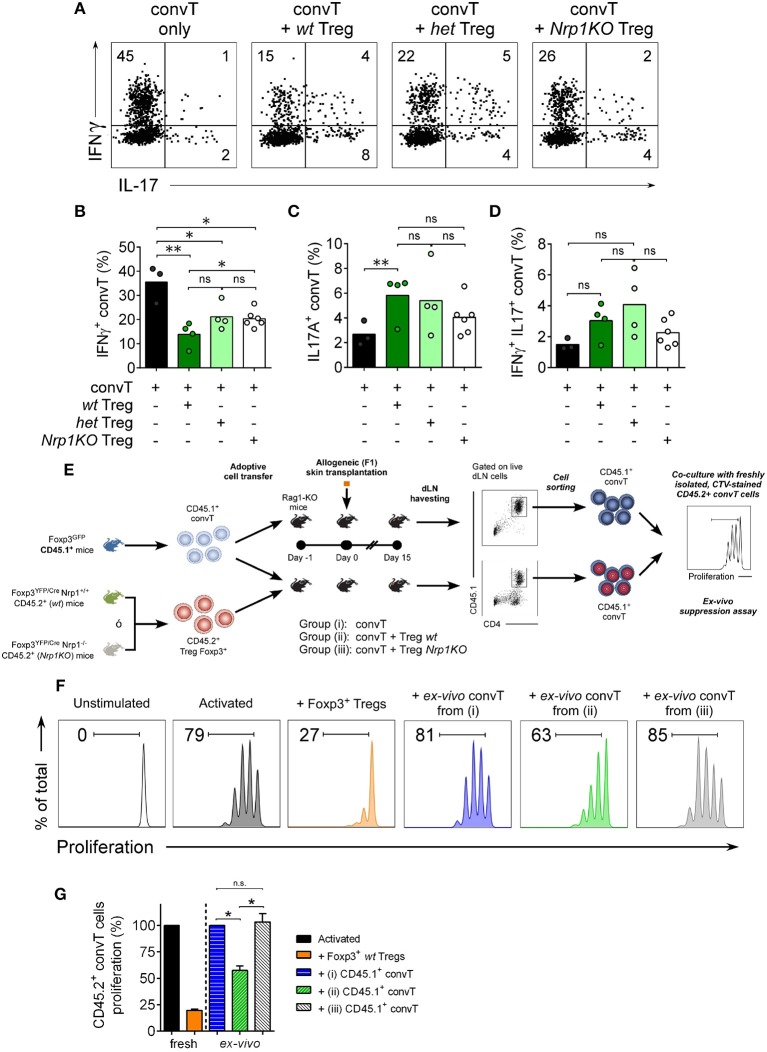
Figure 7.
Nrp1+Treg cells modulate conventional T cell phenotype and function. Mice were transplanted as described in Figure 4. At day 20 post-surgery, graft draining lymph node cells were obtained and stimulated with PMA and Ionomycin in the presence of Brefeldin A. Next, intracellular cytokine staining was performed and the expression of IFNγ and IL-17 on convT cells was determined by flow cytometry. (A) Representative dot plots showing the expression of IFNγ and IL-17 on CD4+CD45.1+ convT cells when transferred alone or with Treg cells from wt, het, or Nrp1KO Treg cells. Bar graphs depicting the frequencies of (B) IFNγ+CD4+ T, (C) IL-17+CD4+ T, and (D) IFNγ+IL-17+CD4+ convT cells when transferred alone (black) or with wt (dark green), het (light green), or Nrp1KO (white) Treg cells. Pooled data from two independent experiments, each circle corresponds to one mouse. Unpaired T-test, * < 0.05; ** < 0.01; ns, not significant. (E) Mice were transplanted as described in Figure 4. At day 15 post-surgery, graft draining lymph node cells were obtained, stained and live CD45.1+CD4+ convT cells were FACS-sorted and tested for suppression function over freshly isolated, CTV-stained CD45.2+ CD4+ convT cells activated with MHC-II+ APCs and soluble anti-CD3 for 72 h. (F) Histograms showing proliferation of fresh CD45.2+ CD4+ convT cells activated alone (dark gray) or in the presence of control Foxp3+ wt Treg (orange) or CD45.1+CD4+ convT cells of dLN of RAG-KO allografted mice from Group (i) (convT alone, blue), Group (ii) (convT plus wt Treg cells, green), or Group (iii) (convT plus Nrp1KO Treg cells, light gray). (G) Percentage of proliferation of fresh CD45.2+ CD4+ convT cells was calculated as described in Materials and Methods. Representative of at least three independent experiments. Bars represent mean ± SEM. Paired T-test, * < 0.05 was used.

