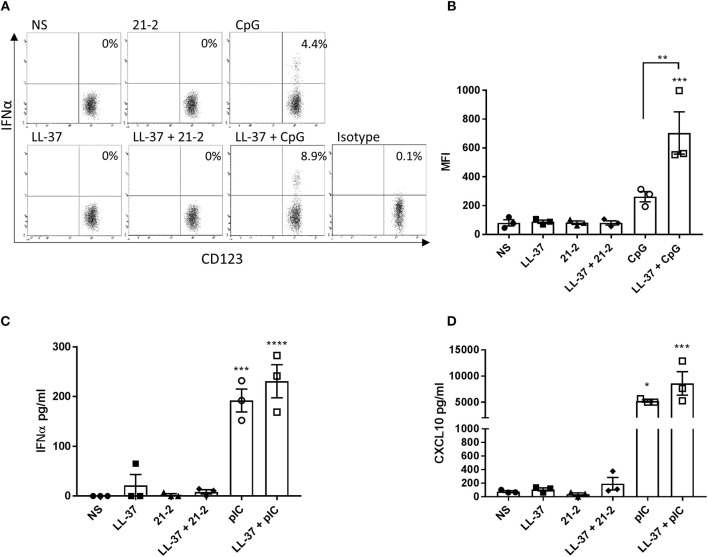
Figure 5.
PBMCs were isolated from whole blood and treated with LL-37 (2.5 μM), Apt 21-2 (100 nM; 21-2), CpG ODN (2.5 μM; CpG), LL-37 + Apt 21-2 (2.5 μM + 100 nM), LL-37 + CpG ODN (2.5 μM each), or left untreated (NS) for 12 h at 37°C 5% CO2. The isotype control was treated with CpG (2.5 μM). After 1 h of stimulation, GolgiPlug was added to all cells (1 μl per ml of media). Following stimulation, the percentage of IFNα+ pDCs was determined by flow cytometry. pDCs were identified using the gating strategy outlined in Figure S1. A representative set of dot plots for one donor is shown (A) with a graph plotting mean fluorescence intensity (MFI) of IFNα for each donor (B). Data shown are mean ± SEM with individual data points of independent donors, n = 3, ANOVA, **p < 0.01, ***p < 0.001. C- PBMCs were stimulated as in A but substituting CpG ODN with poly(I:C) (100 μg/ml) and without addition of GolgiPlug. Cells were incubated for 24 h at 37°C 5% CO2. Supernatants were harvested and tested for IFNα (C) and CXCL10 (D) by ELISA. Data shown are mean ± SEM with individual points of independent donors. n = 3 *p < 0.05, ***p < 0.001, ****p < 0.0001.

