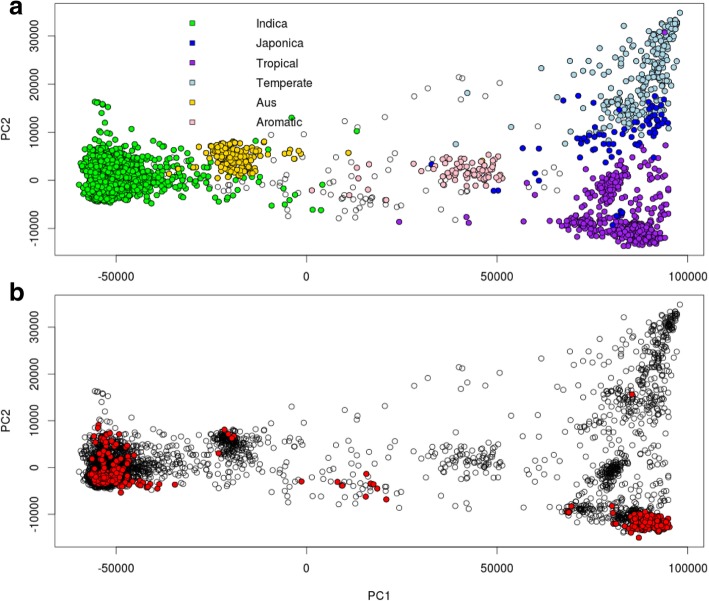
Fig. 2.
a Principal component analysis (PCA) of the rice 3 k SNP Seek data set (Mansueto et al. 2017). The main rice sub-groups are indicated by different colours; blue-japonica, green-indica, purple-tropical, pink-aromatic, light blue-temperate and yellow-aus. b PCA of the 696 Philippine pigmented rice accessions (red dots) overlayed on the PCA of the rice 3 k SNP Seek set. The additive relationship matrix was calculated for each rice data set in rrBLUP, using the R package rrBLUP (Endelman, 2011), and used as input to the PCA

