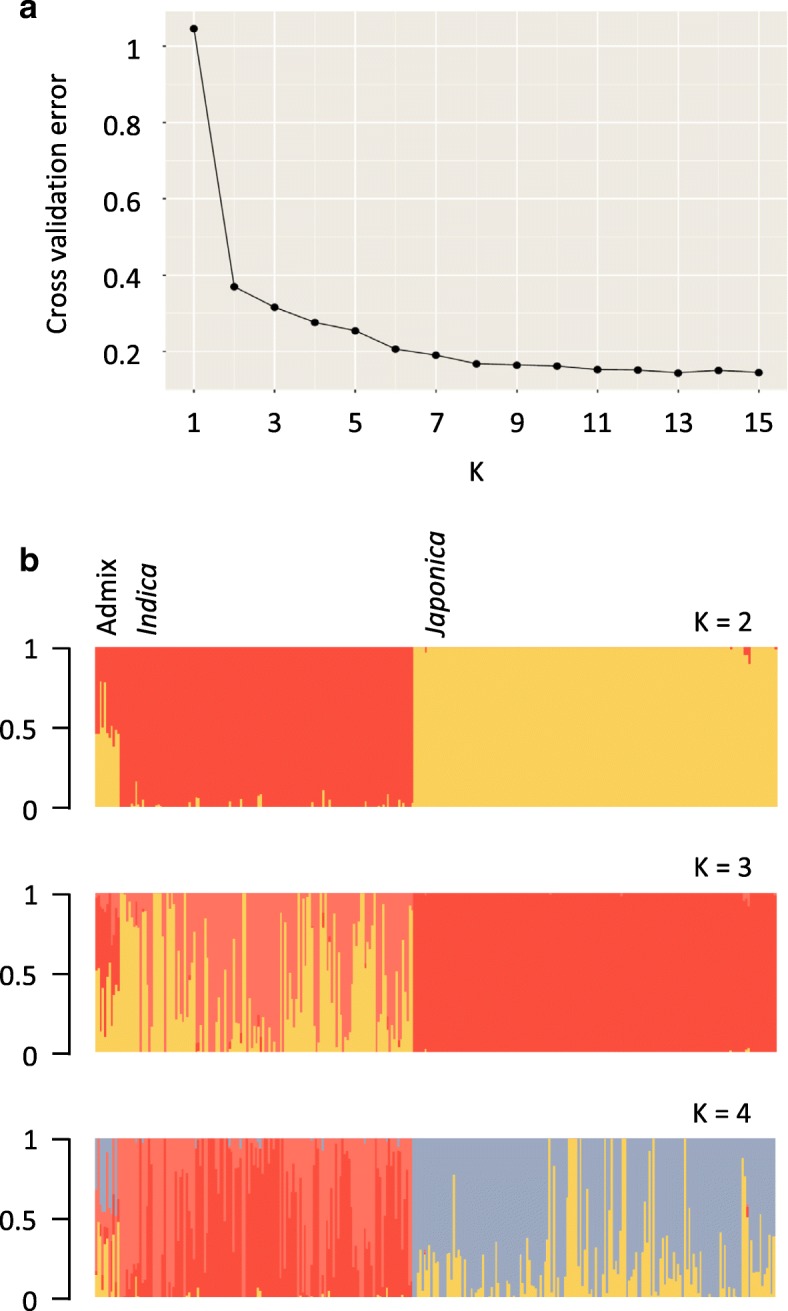
Fig. 3.

Population structure within the 307 core Philippine pigmented rice accessions, showing partitioning into two main populations. a Cross-validation plot. Cross-validation error is shown on the Y-axis (vertical) and the number of hypothetical populations on the X-axis (horizontal). b Individual ancestry inferred with ADMIXTURE. Each individual is represented by a vertical line partitioned by colour. The proportion of the colour making up each vertical line represents the proportion contributed by the ancestral population. The best supported clustering (K = 2) divided the 307 rice accessions into two main groups, corresponding to indica and japonica rice types. With increased K values (K = 3 and 4) additional substructure within each cluster was observed
