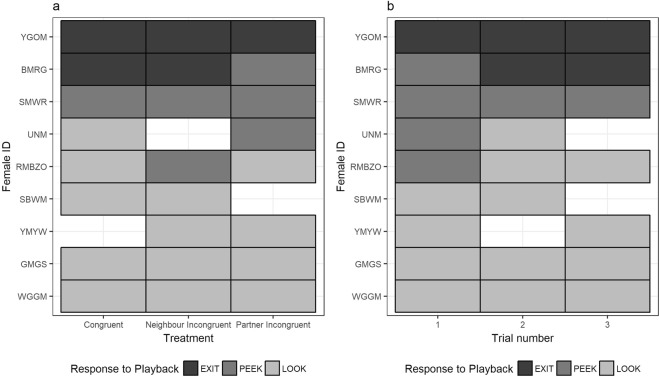
Figure 3.
Tile plots showing responses of focal females to the three playbacks, according to (a) treatment (Congruent, Neighbour Incongruent, Partner Incongruent) and (b) trial number (1–3). Female ID (y-axis) shows colour-ring combinations of focal females. Tile colour corresponds to the behavioural response of the female to the playback: looking at the nest box entrance from an incubating position (LOOK, light grey bars); peeking out of the nest box entrance from a standing position (PEEK, mid-grey bars), and leaving the nest box (EXIT, dark grey bars). Blank tiles represent trials where a reliable measure of females’ initial response to the playback could not be obtained.

