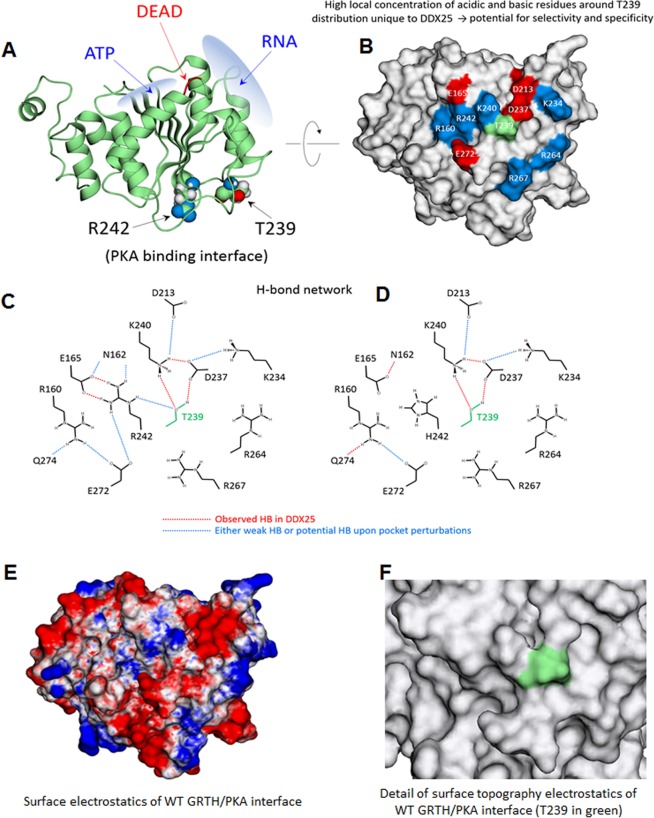
Figure 3.
Structural characterization of GRTH. (A) Domain 1 of DDX25 showing the binding sites of ATP and RNA along with the DEAD-box sequence and the relative positions of T239 and R242. Both residues are solvent exposed and located at the GRTH/PKA binding interface. (B) GRTH/PKA interface on GRTH indicating the basic (blue) and acidic (red) residues surrounding T239; most of these residues are unique to DDX25 including T239 itself; only 5 out of the 12 residues shown are common between DDX25 and DDX19. (C) Intramolecular H-bond network of residues at the GRTH/PKA interface for wild-type GRTH. The network was identified from MD simulations and deemed statistically significant in frequency: red lines indicate strong/persistent H-bonds; blue lines are either weak bonds or strong bonds developed upon mutations of interfacial residues; simulations were carried out for single mutants E165A, K234A, K234D, K240A, K240D, D237H, D237A, R242H (neutral and protonated histidine), R242A and for the double mutants E165A + E272A, E165A + R242A, E165A + K240A. The MD results were used to suggest mutations to be carried out experimentally. (D) like in (C) but for H242 (protonated) observed in infertile patients12. (E) Surface electrostatic potential on GRTH at the GRTH/PKA interface; same orientation as in (B) (red: negative field, blue: positive field, white: neutral field; drawn at the same magnitude of positive and negative field intensities). Note the negative elongated crevice flanked by two regions of positive field; hydrophobic regions are generally outside the interface. (F) Details of surface topography at the interface with T239 highlighted in green.

