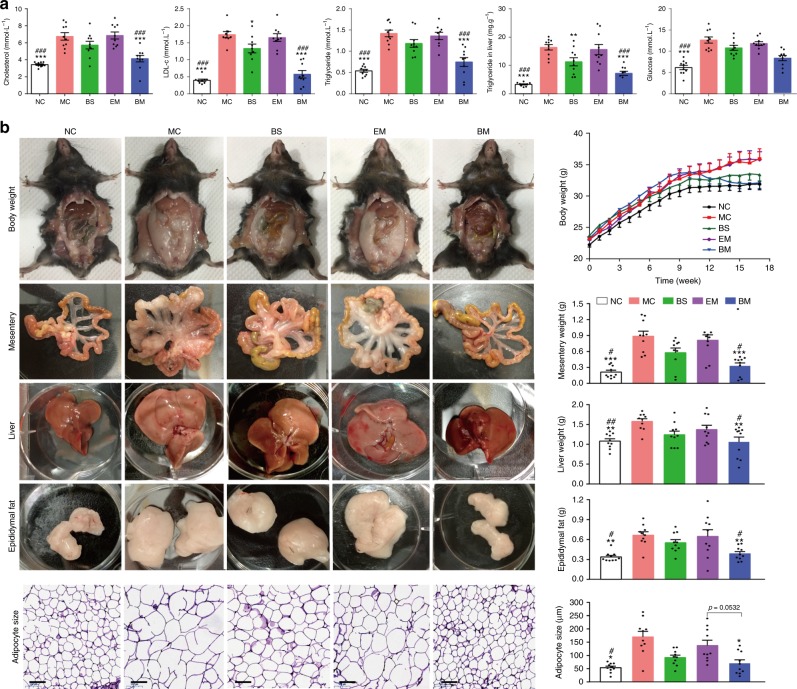
Fig. 6.
In vivo hyperlipidemia, body weight and adiposity analyses. HFD-fed C57BL/6J mice were treated with various BBR formulations by gavage. Untreated mice fed with HFD (MC group) and standard chow food (NC group) were used as control. a Biochemical analyses. Plasma TG, cholesterol, LDL-c, glucose, and hepatic TG were measured with enzymatic methods using an automatic biochemical analyzer. b Representative pictures and weight changes of whole body, mesentery and epididymal fat, liver tissue and size change of adipocyte. Data are presented as mean ± SEM (n = 10), *p < 0.05, **p < 0.01, ***p < 0.001, vs mice in MC group; #p < 0.05, ##p < 0.01, ###p < 0.001, vs mice in EM group, p-values were calculated by unpaired two-sided Student’s t-test. Scale bars, 100 μm (b)

