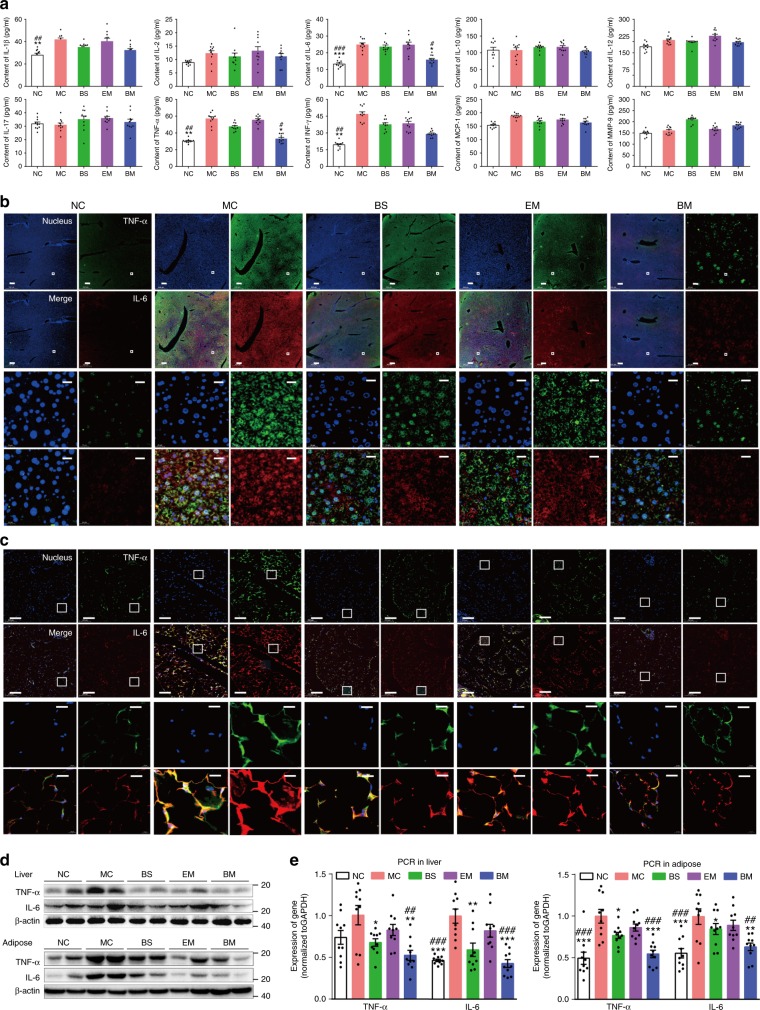
Fig. 8.
Inflammation condition analysis. HFD-fed C57BL/6J mice treated with various BBR formulations by gavage. a Pro-inflammation cytokine levels in plasma. Following the termination of the experiment, blood samples were collected and used for the determination of plasma TNF-α, IL-1β, IL-2, IL-6, IL-10, IL-12, IL-17, MCP-1, MMP-9, and IFNγ levels by enzyme linked immunosorbent assay (ELISA) according to instruction of the manufacturer with a illuminometer at 490 nm. The tissue of epididymal fat and liver were harvested. b Representative photograph of immunofluorescent stained liver tissues for IL-6 (red) and TNF-α (green) visualized using C2t Nikon fluorescent microscope (Morrell, USA). The regions of interest (ROI) are boxed in white, and their magnified images are shown at the bottom. c Representative photographs of immunofluorescent stained adipose tissues for IL-6 (red) and TNF-a (green) visualized using C2t Nikon fluorescent microscope (Morrell, USA). The regions of interest (ROI) are boxed in white, and their magnified images are shown at the bottom. d The protein expression of IL-6 and TNF-α in liver tissue (up) and adipose (down) were evaluated by western blot. e The expression of IL-6 and TNF-α mRNA in liver tissue (left side) and adipose tissue (right side) were evaluated by RT-PCR. Data are presented as mean ± SEM (n = 10). *p < 0.05, **p < 0.01, ***p < 0.001, vs mice in MC group; #p < 0.05, ##p < 0.01, ###p < 0.001, vs mice in EM group, p values were calculated by unpaired two-sided Student’s t-test. Scale bars, 200 μm (b, c bottom left) and 20 μm (b, c, up right)

