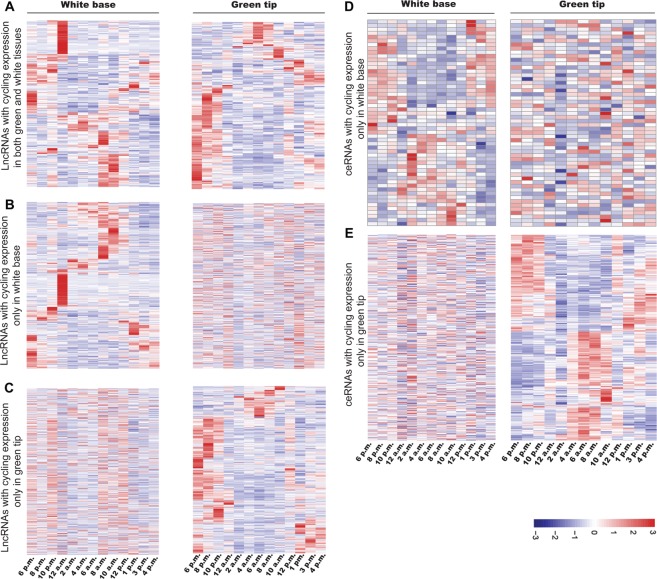
Figure 7.
Diurnal expression profiles of cycling lncRNAs in pineapple leaf green tip and white base tissues. Red represents the highest expression, blue represents the lowest expression, and white represents an intermediate expression. (A) LncRNAs with cycling expression in both white base and green tip. (B) LncRNAs with cycling expression only in white base. (C) LncRNAs with cycling expression only in green tip. (D) Diurnal expression profiles of cycling ceRNAs with a diel peak expression only in white base (E) ceRNAs with cycling expression pattern only in green tip. X axis stands for different time points in white base/green tip. Y axis means for cycling expressed lncRNAs or ceRNAs.

