Fig. 2.
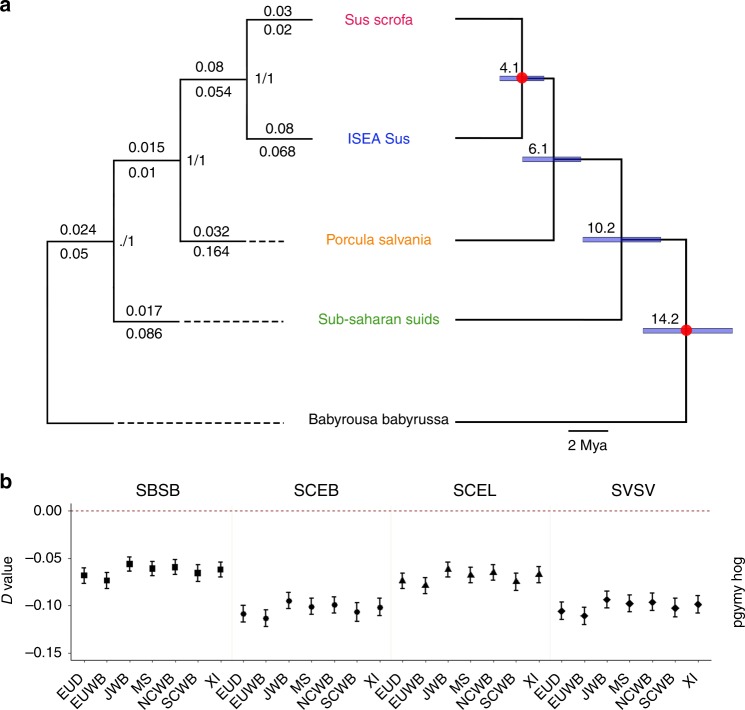
Phylogenetic relationships and divergence of the Suidae species used in the current study and admixture event between pygmy hog and Sus scrofa. a The tree on the left is the ML tree of the Suidae family based on consensus and concatenation methods. Branch length of the consensus analysis above branches, concatenation below branches. Node labels show bootstrap values of the concatenation analysis and concordance factors of the consensus analysis, respectively. The tree on the right is the time tree of divergence. Node labels show age in million years. Blue bars indicate 95% confidence interval and red dots show the calibration points (See Supplementary material Figs. 1–3 for full trees). b A diagram depicting the excess derived allele sharing when comparing sister taxa and outgroups. Each column contains the fraction of excess allele sharing by a taxon (up/down) with the pygmy hog/outgroup compared with its sister taxon (up/down). We computed D-statistics of the form D (X, Y, Pygmy hog, warthog). Error bars correspond to three standard errors. (SBSB = Sus barbatus, SCEB = Sus cebrifons, SCEL = Sus celebensis, SVSV = Sus verrucosus, EUD = European domesticated pig, EUWB = European wild boar, JWB = Japanese wild boar, MS = Meishan, NCWB = Northern China wild boar, SCWB = Southern China wild boar, XI = Xiang)

