
Figure 3.
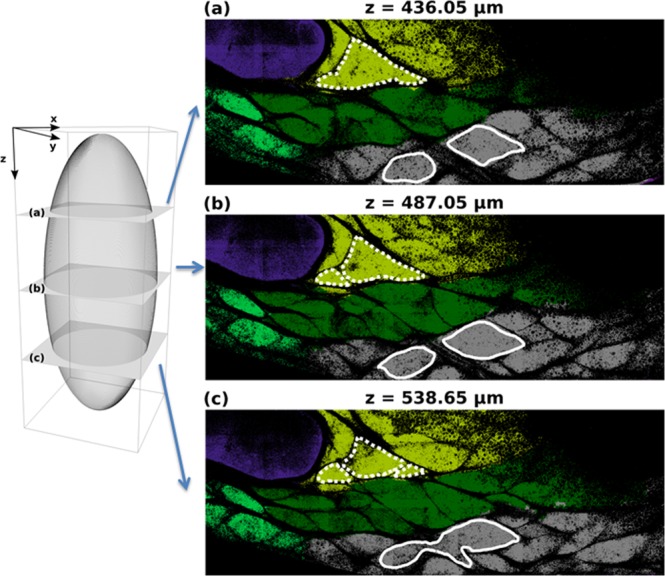
Illustration of misleading 2D slicing on subunit identification. Left panel provides the schematic representation of three different slices (a–c) chosen along the z direction. Right panel illustrates tissue optical section chosen at three z positions: (a) z = 436.5 µm, (b) z = 487.05 µm, (c) z = 536.65 µm. The colours code the 3D segmented subunits given by the automatic post-treatment procedure explained in the Materials and Methods section and illustrated in Fig. 1. The external contour of two different subunits is delineated with white (respectively, dotted and continuous) lines. Depending on the slice (a–c), the 2D optical section of each subunit could appear disconnected whereas they are, in fact, fully connected in 3D.