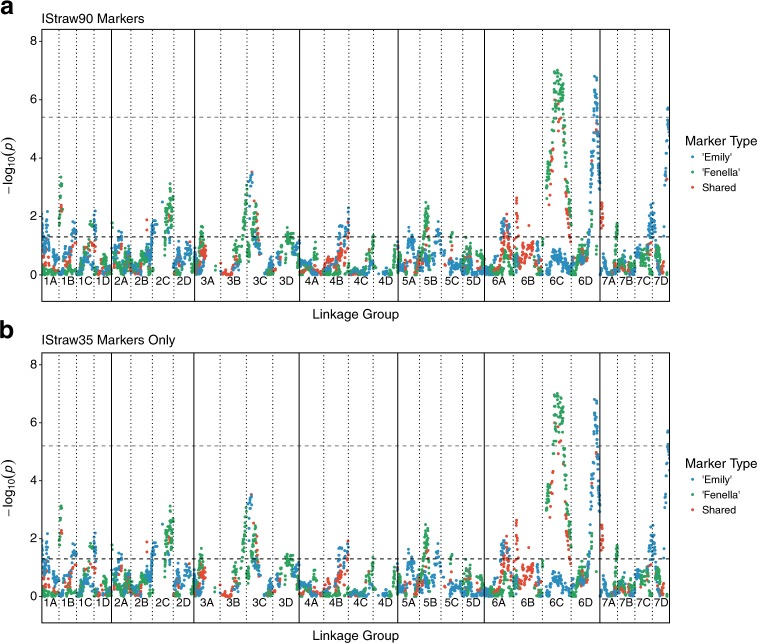
Fig. 1. Kruskal–Wallis quantitative trait loci (QTL) analysis for ‘Emily’, ‘Fenella’ and shared markers across the 28 strawberry linkage groups (1A–7D).
The coloured dots represent −log10(p) scores for the association of each single nucleotide polymorphism marker with resistance to Phytophthora cactorum, while the black dashed horizontal line represents the significance threshold 1.3 (p = 0.05) and the grey dashed horizontal line represents the Bonferroni correction significance threshold 5.4 and 5.2, for the IStraw90 markers (p = 4.31e−06) and IStraw35 markers (p = 5.99e−06), respectively. Regions on linkage groups 1A, 1B, 1C, 1D, 2A, 2B, 2C, 3A, 3B, 3C, 3D, 4B, 4C, 5A, 5B, 5C, 6A, 6B, 6C, 6D, 7A, 7C and 7D were significantly associated with resistance to P. cactorum, based on p < 0.05. a IStraw90 markers and b IStraw35 markers only

