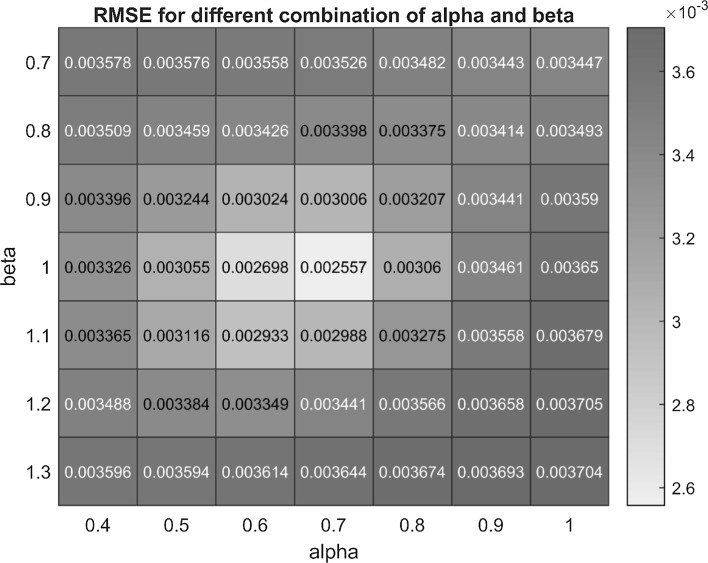
Fig. 8.
Variation in RMSE with change in alpha (α) and beta (β). From the plot, the grid for α and β can be clearly visualized. The method calculates the predicted concentration at each combination of α and β and compares it with the observed concentration to calculate the RMSE in units of concentration. The inset shows the location of the optimal (least) RMSE

