
Fig. 3.
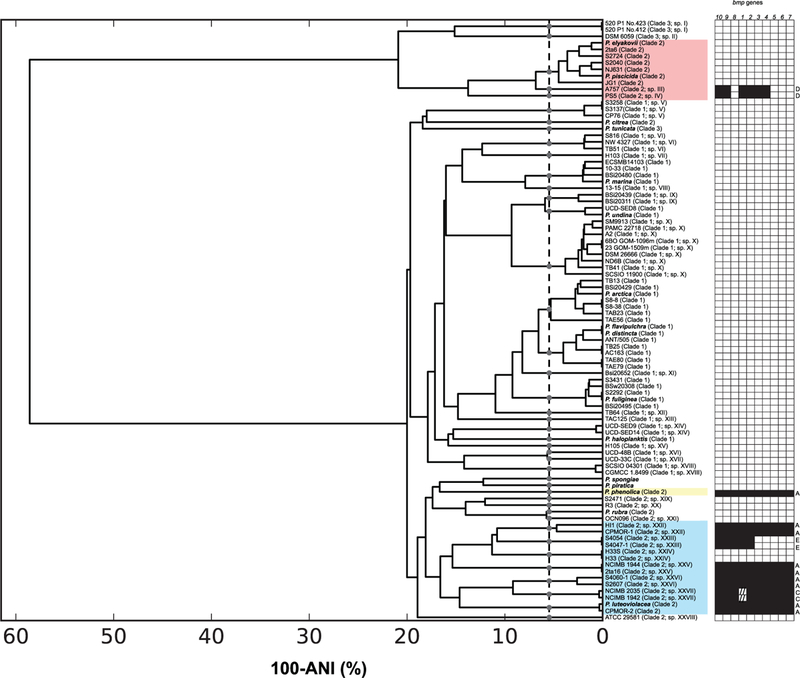
ANI analysis. Average nucleotide identity of 91 Pseudoalteromonas genome sequences. The vertical dashed line specifies 95% ANI and the grey circles designate ANI species groupings. Strain names are followed by clade designations (from Fig. 2) and the 28 ANI groups (95%) that lack type strains indicated by Roman numerals (I–XXVIII). Coloured blocks correspond to sub-clade designations (from Fig. 2). The distribution of the 10 genes in the bmp gene cluster are displayed on the right with the version of the gene cluster (from Fig. 1) indicated on the right. Hash marks indicate an ~150 bp insertion in bmp1.