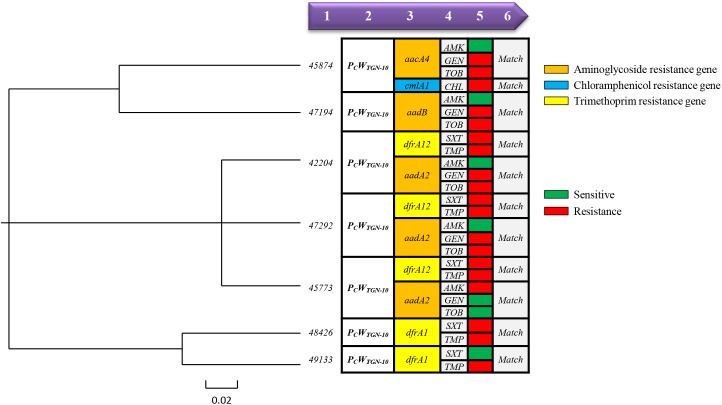
FIGURE 4.
Relationships between resistance gene and resistance phenotype in Proteus strains with strong promoters. (On the left side of this image is a phylogenetic tree based on the DNA sequence of each strain promoter using Vector NTI Advance 11 software, while the right side of this image shows the relationship between the variable region genotype and the resistant phenotype of each strain.) 1Strain number. 2Promoter type. 3Integron variable region genotype (aminoglycoside resistance gene shown in orange, chloramphenicol resistance gene shown in blue and trimethoprim resistance gene shown in yellow). 4and5Phenotype (sensitive shown in green, resistance shown in red). 6Indicates whether the genotype matches the resistant phenotype (at least one genotype corresponds to a resistant phenotype and is considered to be a “Match”).

