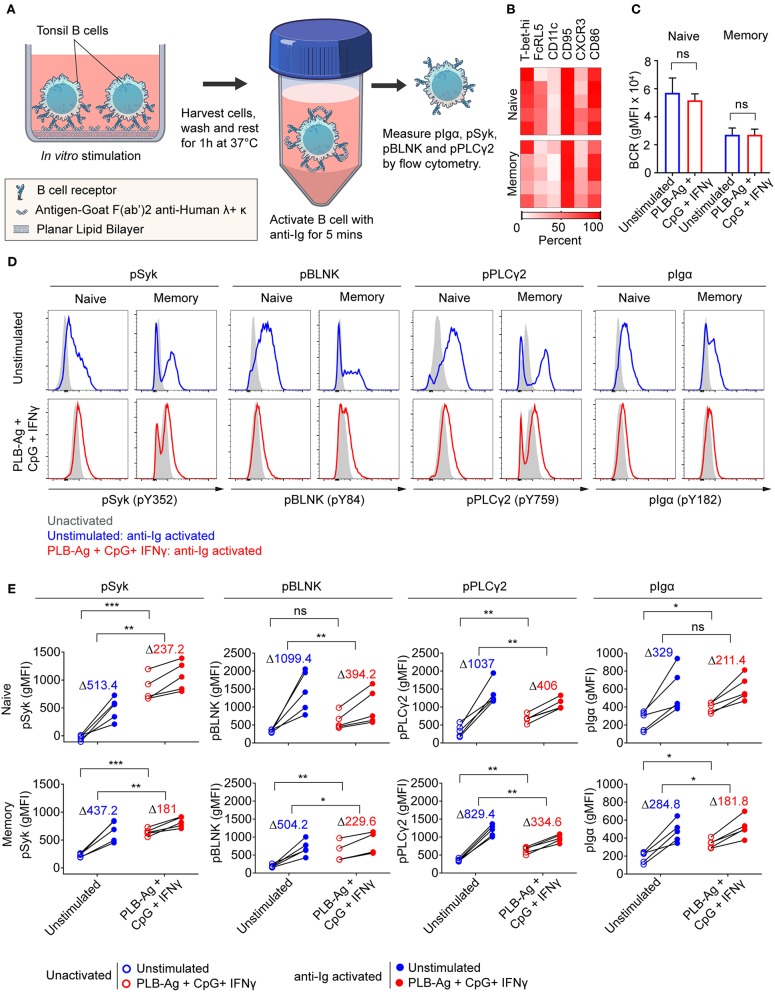
Figure 6.
Naïve and memory B cells stimulated in vitro to express T-bet exhibit altered BCR signaling. (A) Schematic representation of the strategy for measuring the response of tonsil B cells stimulated in vitro for 40 h with antigen on PLB in the presence of CpG and INF-γ to subsequent BCR crosslinking. Following in vitro culture B cells were harvested, washed and rested for 1 h at 37°C. Cells were activated with soluble F(ab′)2 antibodies specific for human IgG + IgA + IgM (H+L) (anti-Ig) for 5 min. Phosphorylation of BCR signaling proteins Syk, BLNK, Igα, and PLCγ2 was analyzed by flow cytometry. (B) Heat map indicating the percent of naïve and memory B cells recovered from in vitro cultures that expressed T-bet and additional malaria-associated atypical MBC markers from five individuals (rows). (C) Comparison of the surface expression of BCR [IgG+IgM+IgA (heavy and light chain)] (gMFI) by naïve and memory B cells recovered from 40 h unstimulated and stimulated cultures (n = 3). Data were analyzed using paired t-test. ns, not significant. (D) Representative histograms indicating expression of phospho-Syk, phospho-BLNK, phospho-PLCγ2, and phospho-Igα in naïve and memory B cells recovered from 40 h cultures in vitro and either activated for 5 min with anti-Ig (blue and red tracings) or left unactivated (shaded gray areas). (E) Comparison of unactivated (empty circles) and anti-Ig activation (solid circles) induced expression (gMFI) of phospho-Syk, phospho-BLNK, phospho-PLCγ2, and phospho-Igα (n = 5) in naïve and memory B cells recovered from 40 h unstimulated and stimulated cultures. Values in the graph indicate the average increase in gMFI induced upon anti-Ig activation [ΔgMFI = gMFI(anti-Ig activated) – gMFI(unactivated)]. Data were analyzed using paired t-test. *P < 0.05; **P < 0.01; ***P < 0.001; ns, not significant.

