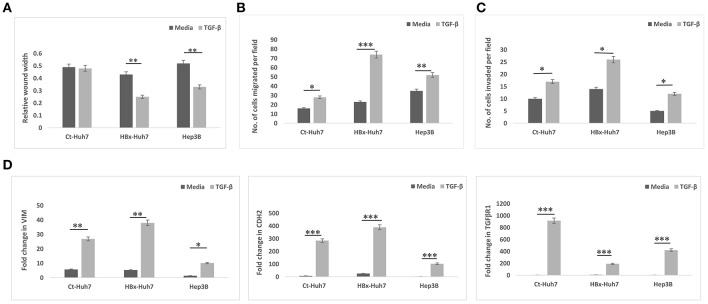
Figure 4.
Epithelial mesenchymal transition in different hepatoma cells in presence of media alone or TGF-β. (A) Bar diagram showing average relative wound width at 24 h divided by that at 0 h in control transfected Huh7 (Ct-Huh7), HBx-Huh7, and Hep3B cells. (B,C) Chemotaxis and matrigel invasion transwell assays depicting migration of hepatoma cells from upper to lower chamber. (D) Relative mRNA expression of mesenchymal genes in hepatoma cells. Data is represented as mean ± SD (n = 3 each). *p < 0.05; **p < 0.01, ***p < 0.001.

