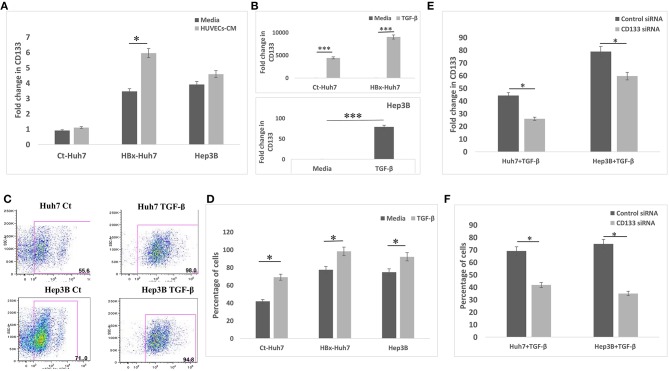
Figure 5.
CD133 expression and silencing in different hepatoma cells. (A) Relative mRNA expression of CD133 in hepatoma cells in presence of media alone and CM of HUVECs. (B) Relative mRNA expression of CD133 in hepatoma cells in presence of media alone and TGF-β. (C,D) Dot-plots and bar diagram of flow cytometry data depicting percentage of CD133 positive cell population in Huh7 and Hep3B cells treated with media alone or TGF-β. (E) Relative mRNA expression of CD133 in TGF-β treated hepatoma cells after transfection with control or CD133 siRNA. (F) Flow cytometry quantitative data of CD133 gene in TGF-β treated hepatoma cells after transfection with control or CD133 siRNA. Data is represented as mean ± SD (n = 3 each). *p < 0.05; ***p < 0.001.

