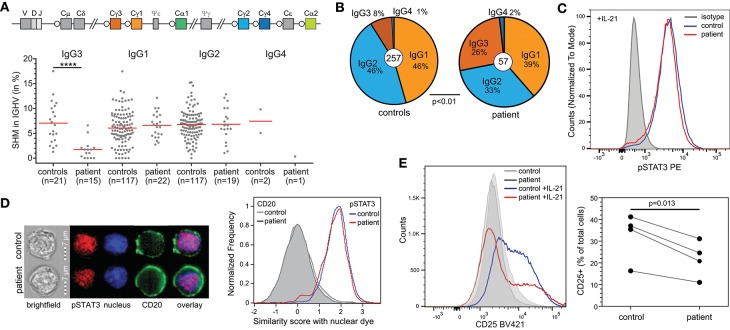
Figure 3.
B-cell defects in STAT1 GOF. (A) Somatic hypermutation levels in IgG subclass transcripts of the patient and controls. (B) Relative distributions of IgG subclasses of unique transcripts. (C) STAT3 phosphorylation in EBV-LCL upon stimulation with IL-21. (D) Nuclear localization of pSTAT3 in EBV-LCL following stimulation with IL-21 as determined with the AMNIS ImageStream. Example images are shown on the left, and the collated events as overlays for nuclear localization scores on the right. (E) CD25 (IL2Rα) expression on EBV-LCL following stimulation with IL-21. Overlays are shown for one experiment to illustrate on the left and the combined data from 4 independent experiments on the right. Statistics: Paired t-test.

