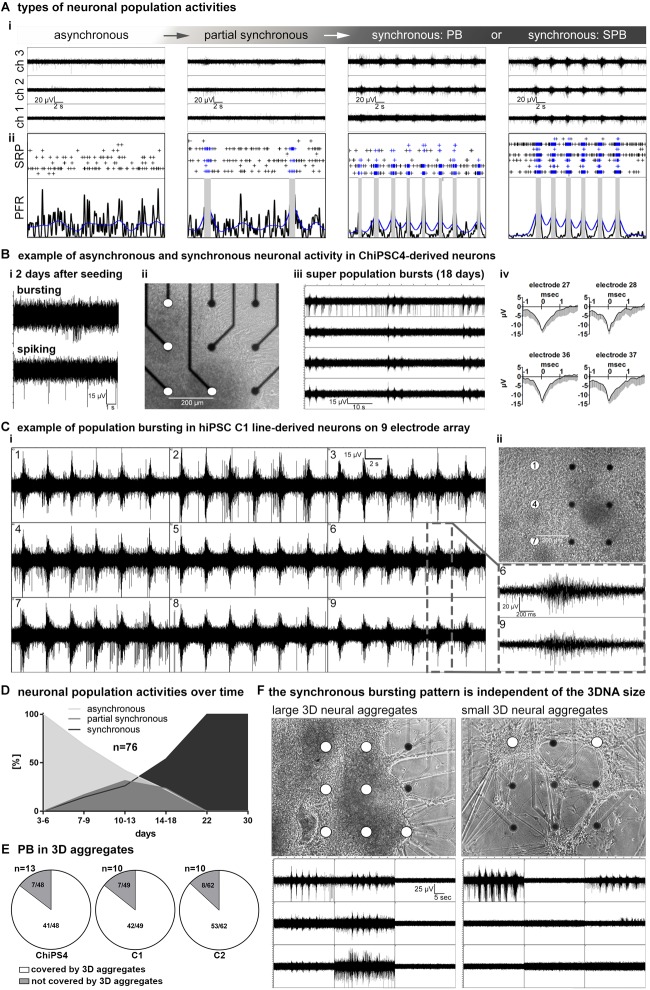
FIGURE 2.
network maturation of hiPSC derived 3D-neural aggregate cultures. (A,i) Exemplary images of MEA-recordings with (A,ii) corresponding spike raster plots (SRP) and population firing rate (PFR) diagrams illustrate the different stages of neuronal network maturation from asynchronously active to highly synchronously active neuronal population activity. (B,i) Example of uncorrelated spiking and bursting activity, (B,ii) phase-contrast image, (B,iii) MEA-recording of synchronous population bursting, (B,iv) mean spike shapes detected by electrodes (white circles) in ChiPS4-derived 3D-neural aggregates placed on nine electrodes of a 6-well MEA. (C,i) Synchronous population bursting detected by electrodes (white circles in ii) covered by hiPSC-C1- derived 3D-neural aggregates and (C,ii) corresponding phase-contrast image 16 days after seeding on a 6-well MEA. Gray box shows details of recorded population bursts depicted from B,i. (D) Diagram summarizes the percentage of 76 individual neuronal cultures showing asynchronous, partially synchronous or synchronous activity at indicated time points. (E) Diagrams show that electrodes which are detecting population bursting (PB) are predominantly covered by 3D neural aggregates. (F) Phase-contrast images show that neuronal cultures comprised of 3D neural aggregates with different diameters show identical pattern of population bursting visualized by corresponding images of MEA recordings. Note, both cultures are derived from the same human iPSC line, experiment and MEA recording was performed at the same time point.

