FIGURE 5.
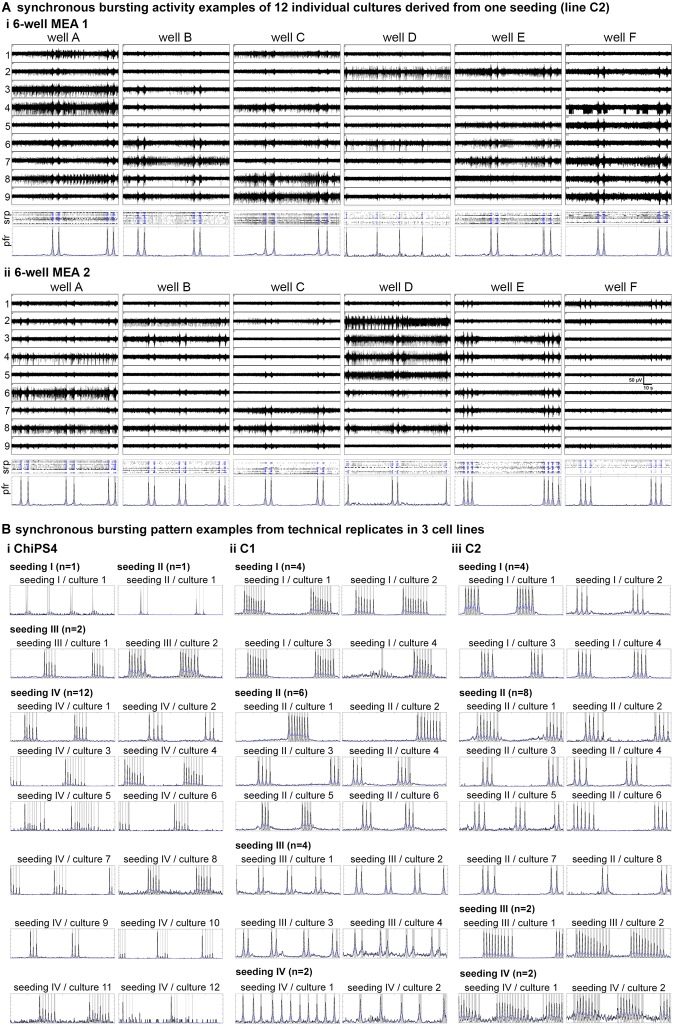
Conserved pattern of population bursting among individual 3D neural aggregate cultures. (A) MEA recordings, spike raster plots (SRP) and population firing rate (PFR) diagrams of C2-derived 3D-neural aggregate cultures (n = 12) 10 days after plating on 6-well MEAs are showing low inter-culture variabilities in synchronous bursting pattern. The channel numbers are marked at the left side of the representative MEA recordings. Crosses in SRP diagrams indicate detected spikes, where blue crosses stand for spikes detected within population bursts (PB). PBs are marked with gray vertical bars in PFR diagrams. For neuronal network parameters see also Supplementary Table S1 (B) Population firing diagrams showing the pattern of population bursting (gray vertical bars) recorded from (B,i) ChiPS4, (B,ii) C1 and (B,iii) C2-derived 3D neural aggregates on 6-well MEAs from four different seedings. Each seeding represents an experiment in which different batches of human iPSC-NSC cryovials (four batches per cell line) were treated as shown in Figure 1 to generate 3D neural aggregates on MEAs. N indicates the number of individual cultures per cell line.

