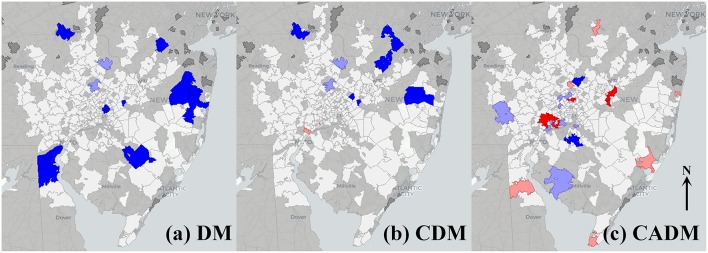
Figure 2.
Local indicators of spatial autocorrelation (LISA) maps for prevalence of the full cohort of dermatomyositis (DM) patients (a), and subtypes classic DM (CDM, b) and clinically amyopathic DM (CADM, c). High-high (red) and low-low (bright blue) spatial clusters, and high-low (pink) and low-high (light blue) spatial outliers relative to neighboring regions are identified. Geospatially non-significant (white) and neighborless (dark gray) regions are visible. Differential spatial clustering is most notable between CDM (b) and CADM (c).

