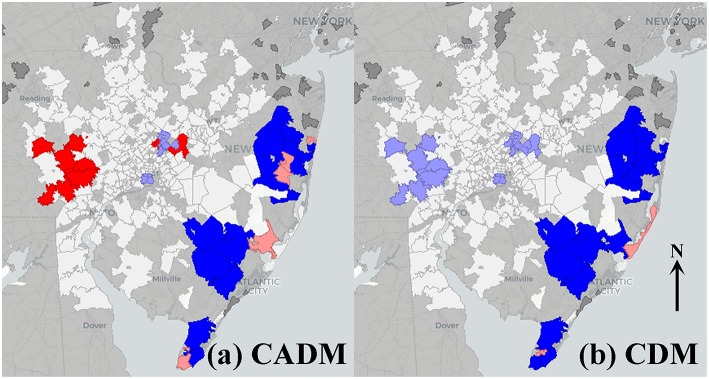
Figure 3.
Bivariate local indicators of spatial autocorrelation (BiLISA) maps for prevalence of clinically amyopathic dermatomyositis (CADM, a) and classic dermatomyositis (CDM, b) vs. point sources. High-high (red) and low-low (bright blue) spatial clusters, and high-low (pink) and low-high (light blue) spatial outliers relative to neighboring regions are identified. In CADM (a), western metropolitan high-high clustering and eastern metropolitan low-low clustering is prominent, while in CDM (b), western low-high outliers and eastern low-low clustering is notable. Geospatially non-significant (white) and neighbor less (dark gray) regions are visible.

