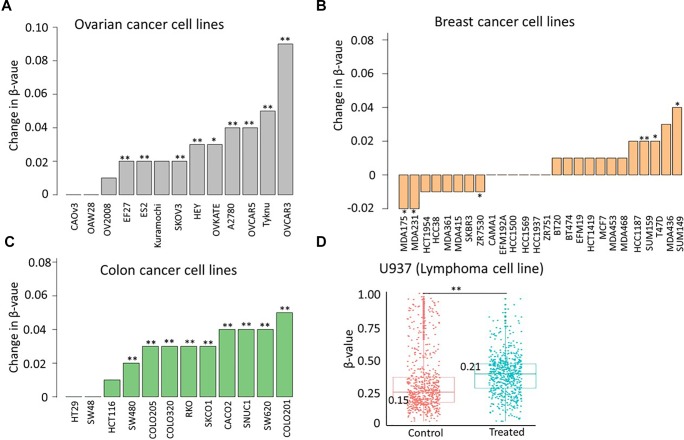
FIGURE 3.
Azacytidine treatment increases methylation of identified sites in a subset of cell lines. Change in median methylation level of identified CpGs in (A) 13 ovarian cancer cell lines (B) 26 breast cancer cell lines, and (C) 12 colon cancer cell lines. The bar plot represents the difference in the median methylation level of identified CpGs between cells treated with 0. 5 μM azacytidine (test group) or carboplatin (mock group) after 72 h. (D) Scatter plot showing the distribution of methylation level of identified probes in untreated (control) and treated cells (5 mM of azacytidine for 72 h) in U937 lymphoma cell lines. The statistical significance was assessed using the non-parametric Wilcoxon test. ∗p < 0.05, ∗∗p < 0.005.

