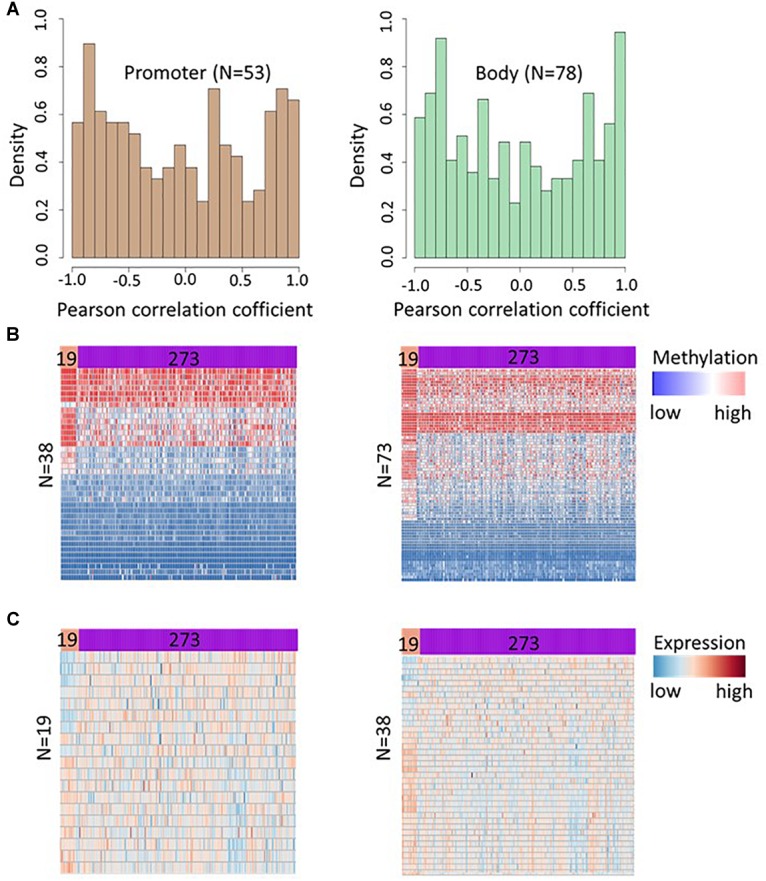
FIGURE 5.

DNA methylation at hypermethylated sites affects gene expression in HCT116 cell lines and TCGA colon adenocarcinoma samples. (A) Histogram depicts density of Pearson correlation coefficients (PCCs) between DNA methylation and gene expression for 130 CpGs in promoter region (left panel) and 200 CpGs in gene body area (right panel). The PCCs were calculated using DNA methylation of a CpGs and the expression level of corresponding genes at day 0 (untreated cells), 5, 14, 24, and 42 days after decitabine treatment. Further, 53 promoter CpGs and 78 gene body CpGs showing a strong methylation-expression correlation (|r| ≥ 0.8) in HCT116 cell lines were selected and their methylation levels were compared between cancerous (n = 273) and adjacent healthy tissues (n = 19) samples in TCGA colon cancer data. A significant difference in methylation level (FDR < 0.05) was observed at 38 promoter and 73 gene body CpGs. (B) Heatmap showing the methylation level of these 38 promoters (left panel) and 73 gene body (right panel) CpGs in healthy tissue and colon cancer tissue. Subsequently, the expression level of genes corresponding to CpGs showing significant methylation differences in TCGA colon cancer data were compared and 19 genes corresponding to significant CpGs in promoter region, and 38 genes corresponding to the significant CpGs in gene body region were found differentially expressed (FDR < 0.05). (C) Heatmap showing the expression profile of genes with significant differences in adjacent healthy tissue (n = 19) and colon cancer samples (n = 273).
