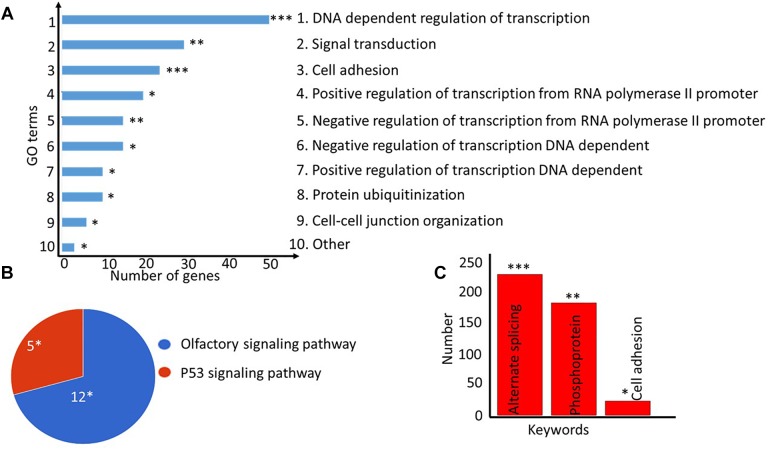
FIGURE 6.
Gene ontology (GO) and pathway enrichment analyses of genes corresponding to differentially methylated CpGs. (A) Top-10 most significantly enriched cellular processes are shown as a bar plot. The lengths of the bars denote the number of genes present in each of the top GO categories. (B) Pie-chart showing the significantly enriched pathways for the genes. The number of genes present in each pathway group is shown along with the hypergeometric test p-value corrected for multiple testing as implemented in the DAVID tool. (C) The keywords enrichment analysis for the genes is shown as a bar chart. The length of the bar represents the number of genes enriched for each keyword, the FDR-corrected p-value is shown at the top. ∗FDR < 0.05; ∗∗FDR < 0.005; ∗∗∗FDR < 0.0005.

