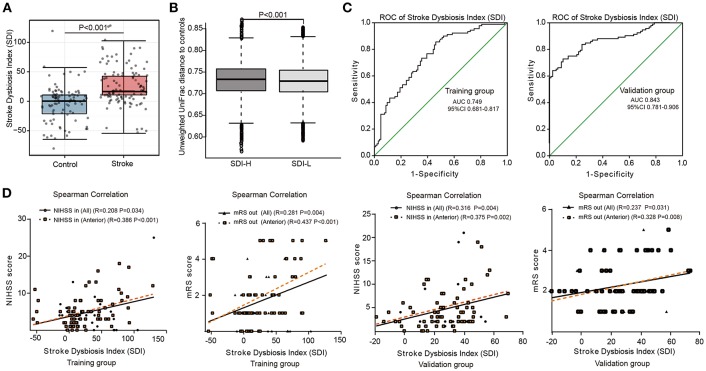
Figure 1.
Model of Stroke Dysbiosis Index (SDI) in patients. (A,B) The training group. (A) Comparison of the SDI between the stroke and control group. (B) Distances of higher SDI patient groups (SDI-H) and lower SDI patient groups (SDI-L) to controls. (SDI-H: SDI≥17.0, n = 52; SDI-L: SDI < 17.0, n = 52) (C) Receiver operating characteristic (ROC) curve of the SDI model in the 194-member training group (104 patients and 90 controls) (C, left) and the 153-member validation group (83 patients and 70 controls) (C, right). (D) SDI of stroke patients correlating with the NIHSS score at admission (NIHSS in) and mRS score at discharge (mRS out) in both the training and validation groups. Training group (all patients [n = 104]; patients with anterior circulation stroke [n = 72]); Validation group (all patients [n = 83]; patients with anterior circulation stroke [n = 65]). ROC, receiver operating characteristic curve; AUC, area under curve; NIHSS: National Institutes of Health Stroke Scale; mRS: modified Rankin Scale; NIHSS in, recorded on admission; mRS out, recorded at discharge. Spearman's correlation. Boxes denoted the interquartile range (IQR) between the first and third quartiles and the line within denoted the median; whiskers denoted the lowest and highest values within 1.5 times IQR from the first and third quartiles, respectively. Circles denoted data beyond whiskers.

