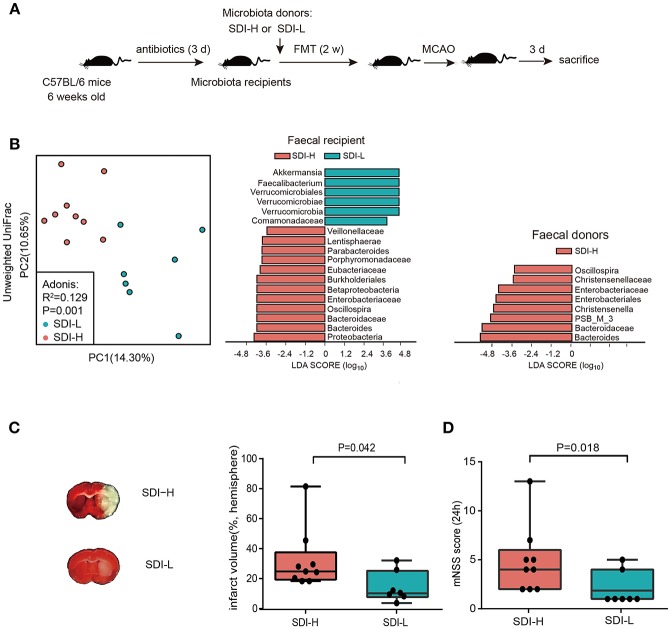
Figure 2.
Causality experiment in mice model. (A) Animal experiment. (B) The principle coordinate analysis (PCoA) result showed the group patterns of the SDI-H and SDI-L recipient mice group based on the unweighted UniFrac distances (SDI-H, n = 9; SDI-L, n = 7) (B, left). The Linear discriminant analysis effect size (LEfSe) identified the most differentially abundant taxon between two recipient mice groups (B, middle) or two donor groups (B, right). Four genera (i.e., Oscillospira, Enterobacteriaceae, Bacteroides, and Bacteroidaceae) enriched in SDI-H donor feces (B, right) were successfully transplanted to SDI-H recipient mice (B, middle). (C) Representative Images of TTC-stained ischemic lesion (C, left) and quantification of infarct volume ratio accounting for hemisphere (C, right) in SDI-H and SDI-L mice 3 d after MCAO induction. (D) Modified neurological severity scores at day 1 (24 h) after MCAO. FMT indicated fecal microbiota transplantation. MCAO, middle cerebrovascular artery occlusion; PC, principle coordinate analysis (PCoA). Boxes denoted the interquartile range(IQR) between the first and third quartiles and the line within denoted the median; whiskers denoted the lowest and highest values within 1.5 times IQR from the first and third quartiles, respectively. Circles denoted data beyond whiskers.

