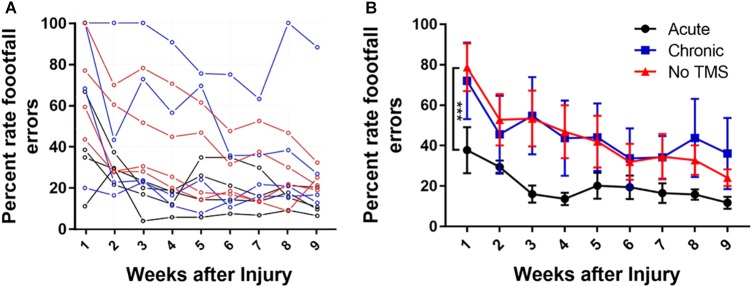
FIGURE 2.
(A) Line graph showing mean gridwalk scores measured in terms of percent footfall errors across a period of 9 weeks for each animal across all groups. The acute-TMS group had the lowest percent footfall errors compared to the chronic and no-TMS group. (B) One-way ANOVA with multiple comparison analyses show significant improvement in percentage of footfall errors measured in acute (n = 4) vs chronic (n = 4, p = 0.0009) and acute vs no-TMS groups (n = 3, p = 0.0015). No significant differences were found between the chronic vs no-TMS groups across 9 weeks.

