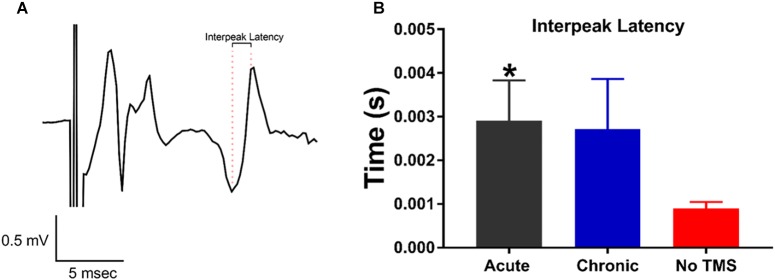
FIGURE 3.
MEP responses recorded from the forepaws evoked by transcranial magnetic stimulation (TMS) pulses. (A) Representative MEP trace showing the distance in time between consecutive maximal peaks defined as inter-peak latency. (B) Data summary show a significant increase in inter-peak latency in rats treated with acute-TMS vs the no-TMS group (p = 0.018, denoted by ∗). The chronic vs. no-TMS group did not show significant differences in inter-peak latencies.

