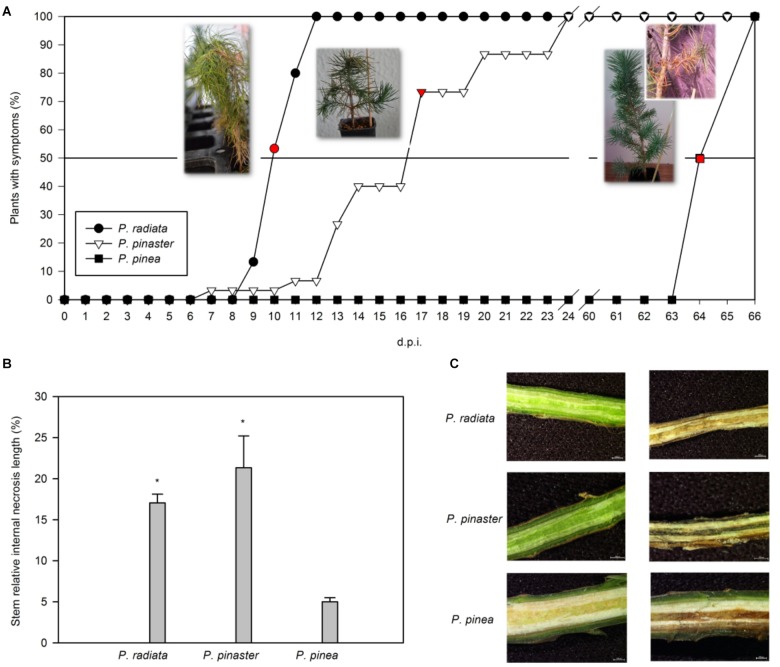
FIGURE 1.
Progression of pitch canker disease in Pinus. (A) Time course of the percentage of plants inoculated with F. circinatum showing symptoms for each pine species. Sampling points were carried out individually for each species when at least 50% of the inoculated plants presented symptoms (red points). Images representative of the symptoms at each sampling point are presented. Days post-infection (d.p.i.). (B) Stem relative internal necrosis length of non-inoculated controls (black bars) and of plants inoculated with F. circinatum (grey bars) when 50% of the inoculated plants of each species expressed disease symptoms. Data are presented as mean ± SE. Asterisks on grey columns indicate significant differences between treatments for the correspondent species (p ≤ 0.05). (C) Stem internal necrosis representative of non-inoculated controls (left column) and plants inoculated with F. circinatum (right column) of each pine species observed using a zoom stereomicroscope when 50% of the inoculated plants of each species expressed disease symptoms.

