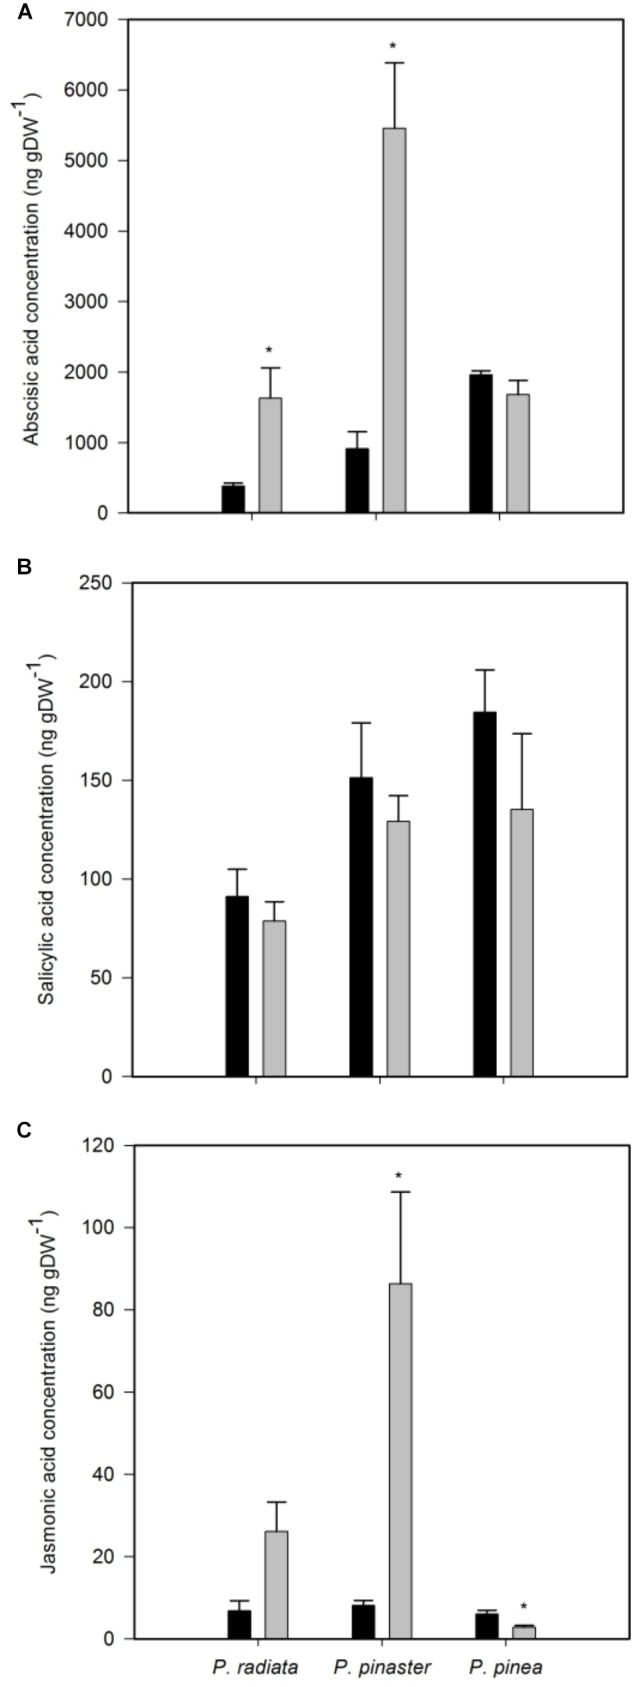
FIGURE 4.

Hormones concentration of non-inoculated controls (black bars) and plants inoculated with F. circinatum (grey bars) when 50% of the inoculated plants of each species expressed disease symptoms. (A) Abscisic acid. (B) Salicylic acid. (C) Jasmonic acid. Data are presented as mean ± SE. Asterisks on grey bars indicate significant differences between treatments for the correspondent species (p ≤ 0.05).
