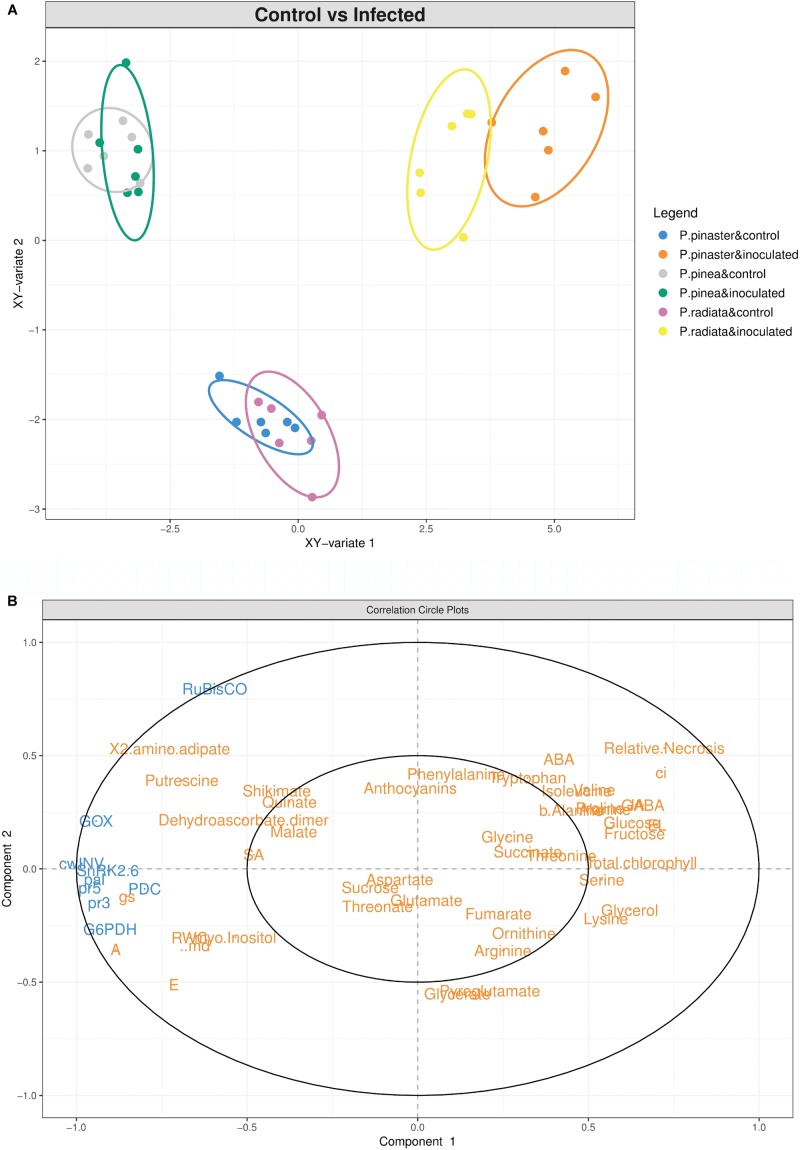
FIGURE 7.
Integrated data analysis. (A) Sparse partial least squares (sPLS) regression analysis of the complete dataset of physiological, hormonal, gene expression and primary metabolism alterations occurring in Pinus inoculated with F. circinatum and their respective non-inoculated controls when 50% of the inoculated plants of each species expressed disease symptoms. First two components are plotted in the graph. (B) Correlation circle plot of the components represented in the sPLS regression analysis. Gene expression levels (blue) were used as predictor matrix for metabolite and physiological responses (orange).

