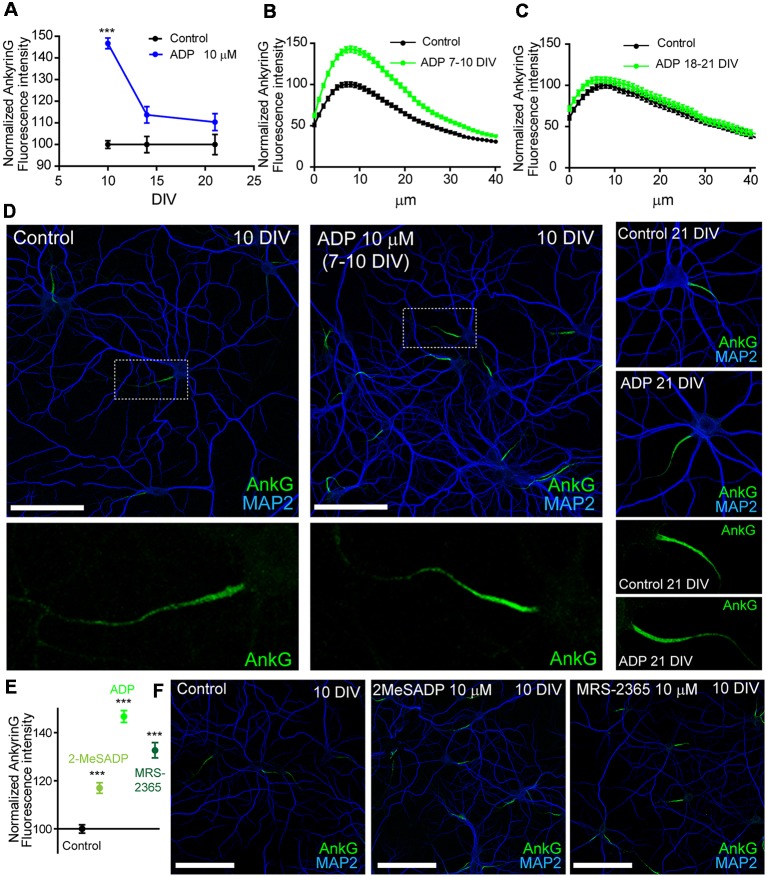
Figure 1.
ADP and P2Y1 agonists potentiates ankyrinG expression during early axon initial segment (AIS) development. (A) Normalized ankyrinG fluorescence intensity in 10, 14 and 21 DIV hippocampal neurons. Neurons were treated with ADP for 3 days before fixation (blue symbols). Data were acquired from three independent experiments (30 neurons/experimental condition in each experiment). Same pool of neurons was used for each experiment and fixed at different times. All images were acquired by confocal microscopy using the same fluorescence parameters. Statistical differences were analyzed by a Kruskal-Wallis test followed by a Dunn’s multiple comparisons post-test. Adjusted p values: ***p < 0.001. (B,C) Normalized AnkyrinG intensity profile along the AIS of 10 DIV (B) and 21 DIV (C) hippocampal neurons in the presence (green line) or absence (black line) of 10 μM ADP treatments. (D) Control and ADP treated 10 DIV and 21 DIV neurons stained with MAP2 (blue) and ankyrinG antibodies (green). Scale bar = 100 μm. Four times-magnification of the ankyrinG staining (green) at the AIS is shown below images. (E) Normalized ankyrinG intensity at the AIS of 10 DIV neurons treated with ADP and P2Y1 agonists 2-methylthioadenosine diphosphate trisodium salt (2MeSADP) or MRS-2365 from 7 to 10 DIV. Data were acquired from three independent experiments (30 neurons/experimental condition in each experiment). ***p < 0.001, two-tail t-test. (F) 10 DIV hippocampal neurons stained with MAP2 (blue) and ankyrinG antibodies (green) treated with 2MeSADP (10 μM) or MRS-2365 (10 μM). Data in graphs are represented as the mean ± SEM.

