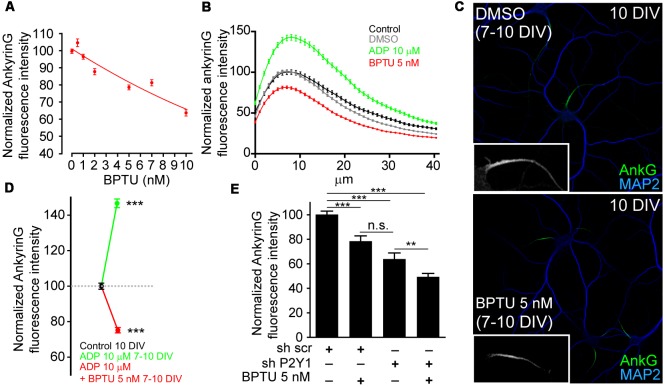
Figure 3.
P2Y1 pharmacological inhibition decreases ankyrinG accumulation at the AIS. (A) Normalized ankyrinG intensity on 10 DIV hippocampal neurons treated from 7 DIV with increasing concentrations of the P2Y1 antagonist, BPTU (0.5, 1, 2, 5, 7 and 10 nM). Concentrations higher than 10 nM affected the morphology of supporting glial cells and were discarded to avoid secondary effects on neurons. (B) AnkyrinG intensity profile along the AIS of hippocampal neurons treated from 7 to 10 DIV with vehicle black line), DMSO (BPTU vehicle, gray line), ADP (green line) and BPTU (red line). (C) 10 DIV neurons stained with MAP2 (blue) and ankyrinG antibodies (green) and treated with vehicle (control) or 5 nM BPTU from 7 to 10 DIV. Inserts show a magnification of the respective AIS. (D) Normalized ankyrinG intensity on 10 DIV hippocampal neurons treated from 7 DIV with 10 μM ADP and BPTU 5 nM, alone or in combination. (E) Normalized ankyrinG intensity on 10 DIV shscr or shP2Y1 nucleofected hippocampal neurons treated with BPTU from 7 DIV. Data were acquired from three independent experiments (at least 30 neurons/experimental condition in each experiment). **p < 0.01, ***p < 0.001, n.s. not significant, two-tail t-test. Data in graphs are represented as the mean ± SEM.

