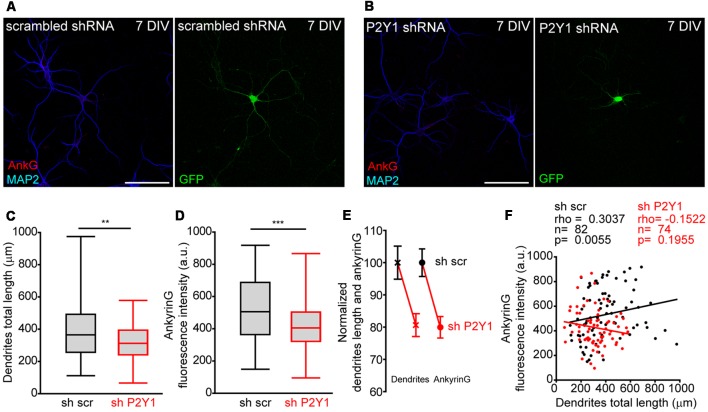
Figure 4.
No correlation between P2Y1 suppression-mediated decrease of dendrites length and ankyrinG density. (A,B) Representative images of 7 DIV hippocampal neurons nucleofected with scrambled or P2Y1 shRNAs. After nucleofection neurons were kept in culture for 7 DIV and stained with MAP2 (blue) and ankyrinG (red) antibodies. Nucleofected neurons were identified by GFP expression (green). (C,D) Box-plots represent total dendritic length (C) and ankyrinG intensity (D) of 7 DIV scrambled sh (sh scr) or shP2Y1 nuclefected neurons from the same pools in three different experiments. Line inside the box represents the median, and upper and bottom lines represent the maximum and minimum values. **p < 0.01, ***p < 0.001, two-tail t-test. (E) Normalized mean ± SEM of dendrites length and ankyrinG intensity of data represented in (C,D). (F) Correlation graph of dendrites length and ankyrinG intensity for each individual neuron analyzed in the study. Control neurons (shscr) are represented in black and neurons expressing P2Y1 interference RNA (shP2Y1) are in red. Data were analyzed first with two normality tests (Shapiro-Wilk and Kolmogorov-Smirnov). Not all data sets did fit a normal distribution and a non-parametric correlation test (Spearman) was performed. Regression lines are shown for shscr (black) and shP2Y1 (red) neurons. The number of neurons, Spearman r coefficient and p values are indicated in (F). A positive correlation is observed in control neurons, while there is no significant correlation in neurons expressing shP2Y1 interference RNA.

