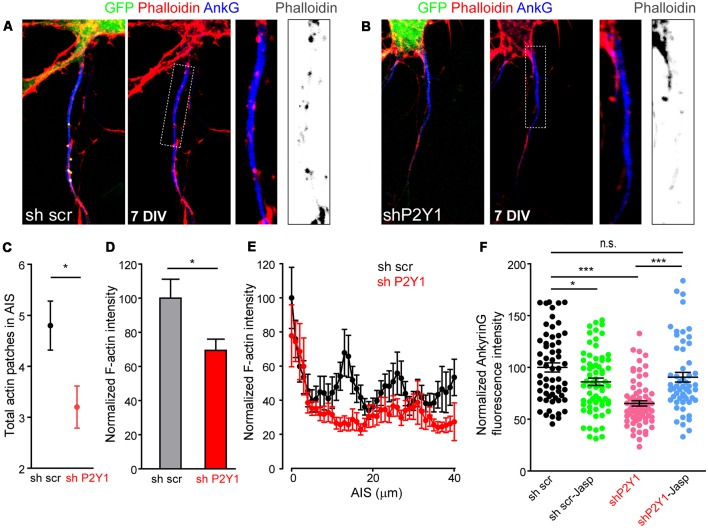
Figure 7.
P2Y1 suppression alters AIS F-actin. (A,B) Representative images of 7 DIV neurons nucleofected with scrambled (A) or P2Y1 (B) shRNAs. AISs were identified by ankyrinG staining (blue) and Phalloidin-Alexa594 served to identify F-actin (red). Nucleofected neurons were identified by their GFP expression (green). Panels show AIS region of the respective neurons and a 2.5× magnification of AIS. Gray scale images show phalloidin staining at the respective AISs. (C) Graph represents the mean ± SEM number of actin patches identified in scrambled (black, n = 20) and shP2Y1 (red, n = 20) AISs. *p < 0.05, two-tail t-test. (D) Total AIS F-actin intensity based on Phalloidin-Alexa 594 fluorescence intensity along ankyrinG signal in 7 DIV shscr and shP2Y1 neurons. *p < 0.05, two-tail t-test. (E) Plot profile of F-actin intensity along AIS in 7 DIV scrambled shRNA (n = 24, black) or P2Y1 shRNA (n = 22, red) neurons. Data are represented as the mean ± SEM of values every micron. (F) Scatter plot and mean ± SEM representing normalized ankyrinG intensity of each 7 DIV scrambled shRNA (sh scr) or P2Y1 shRNA (shP2Y1) nucleofected neuron, treated or not with the actin stabilizer jasplakinolide (10 nM) during 4 h prior to fixation. Statistical differences were analyzed by a Kruskal-Wallis test followed by a Dunn’s multiple comparisons post-test. *p < 0.05, ***p < 0.001, n.s., non-significant.

