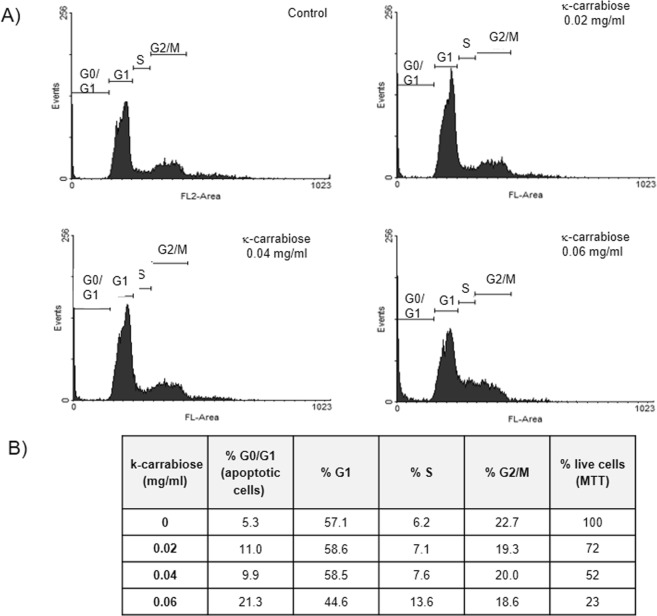
Figure 4.
Influence of κ-carrabiose on LM2 cell cycle. LM2 cells were incubated with κ-carrabiose, at different concentrations, during 48 h and afterwards, the DNA was stained with propidium iodide and cell cycle was analyzed by flow cytometry as described in Materials & Methods. (A) The histograms show the number of cells (events) in each phase of the cell cycle. FL-area denotes propidium iodide fluorescence; (B) the Table shows the percentage of cells in each phase of the cycle and the correlation with the number of living cells determined by the MTT assay.

