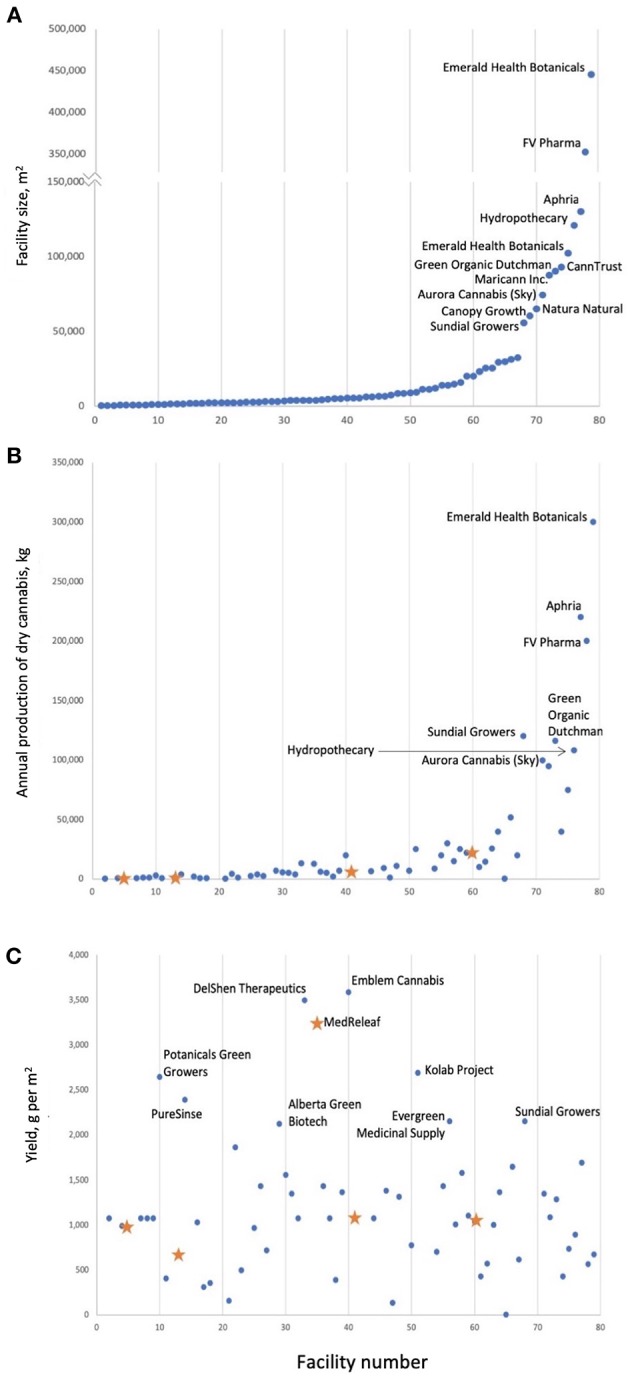
Figure 1.

Cannabis production in Canada; facilities are numbered by facility size (A). Annual production tends to increase with facility size (B) not yield per square meter (C). It is important to note that it is unclear if facility size is always equal to the area of the cannabis production space. Blue dots are projected yields; orange stars are actual yields and correspond to AB Labs (Facility #5), United Greeneries (Facility #13), MedReleaf (Facility #35), Mettrum (Facility #41), WeedMD (Facility #60), and Canopy Growth (Facility #69). Values are current as of April 2018.
