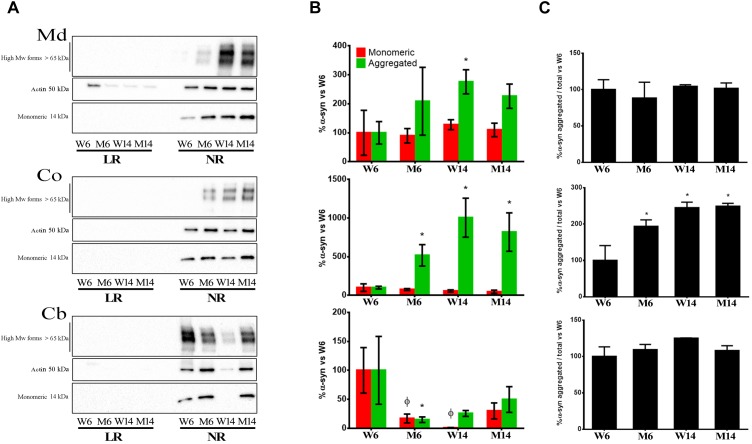
FIGURE 5.
(A) Immunoblotting distribution of monomeric, oligomeric (anti- alpha synuclein [EPR20535] antibody, from Abcam) and aggregated α-syn (5G4 antibody, from Millipore) forms in midbrain (Md) cortex (Co) and cerebellum (Cb) across the experimental cohorts in lipid raft (LR) and non-raft (NR) fractions. (B) Quantification of monomeric and aggregated α-syn forms in non-raft fractions (since this protein was absent or only slightly represented in lipid rafts) from the immunoblotting assay from the same three CNS functional areas normalized versus W6. Notice that the graph shows WB immunosignals normalized vs. young healthy controls’ (W6) values to better reflect changes in distribution and configuration of α-syn in response to age and treatment. Therefore, the statistical significance refers to the magnitude of the relative change of α-syn amount vs. control. Actin immunoblotting bands are included as loading controls). ∗p < 0.05, unpaired t-test with Welch’s correction; ?p < 0.05, Two-way ANOVA with Fisher’s LSD. (C) Percentage of aggregated α-syn vs. total α-syn. ∗p < 0.05, One-way ANOVA with Newman–Keuls multiple comparison test vs. W6 (N = 4).

