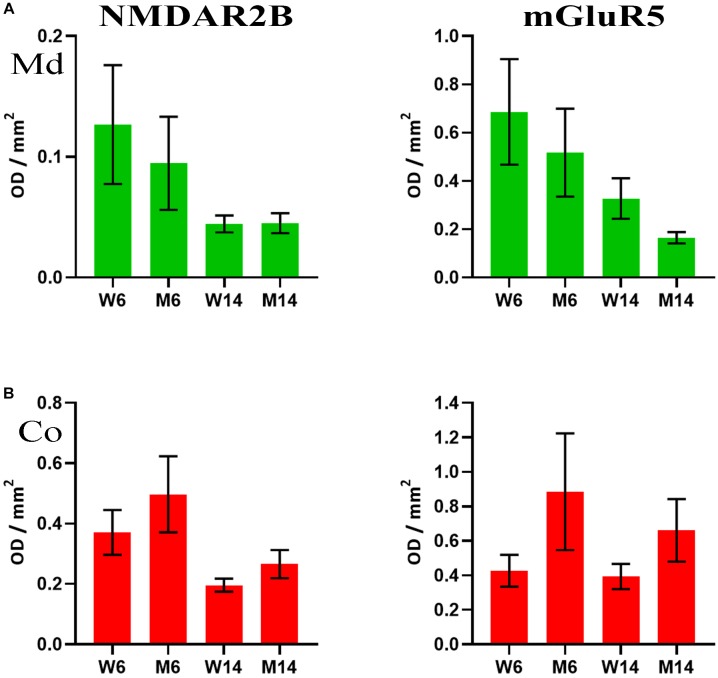
FIGURE 7.
(A) Quantification of NMDAR2B (left) and mGluR5 (right) receptors as analyzed by slot-blot of lipid raft (LR) fractions of midbrain (Md) in our four experimental cohorts. Values were normalized vs. flotillin-1. (B) Quantification of NMDAR2B (left) and mGluR5 (right) receptors as analyzed by slot-blot of lipid raft (LR) fractions of cortex (Co) in our four experimental cohorts. Values were normalized vs. flotillin-1. One-way ANOVA with Newman-Keuls multiple comparison test vs. W6 (N = 4). No significant differences were found between treated and saline littermates, or between young and aged animals.

