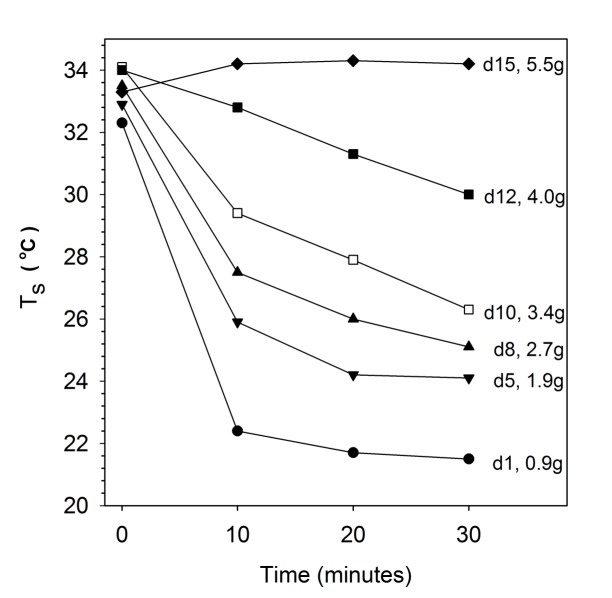
FIGURE 2.
Cooling rates of desert hamsters at different ages from day 1 (d1) to day 15 (d15) at Ta 21 ± 1.0°C with corresponding body masses. Note the fast decline of surface temperature (Ts) measured with infrared thermometer on day 1 and the reduction of cooling with age. Only means are shown for clarity, SD are provided in Table 1.

