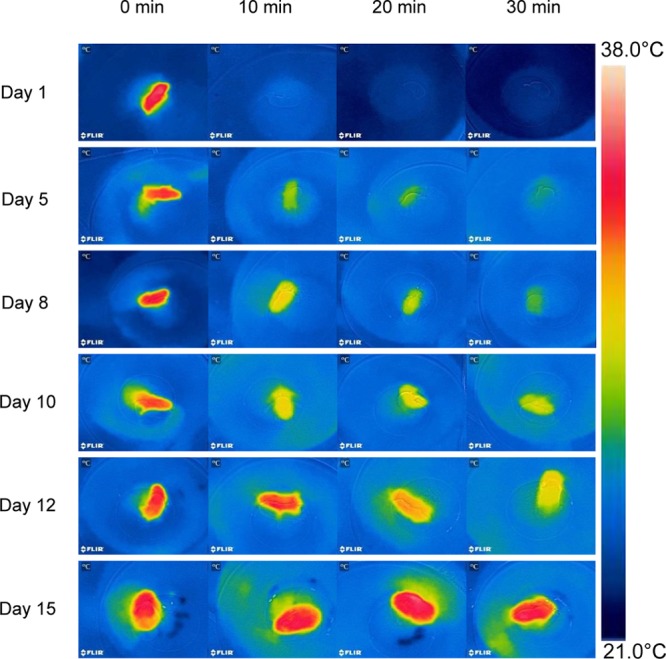
FIGURE 3.

Thermographs of a representative desert hamster at each age experienced a cold exposure at Ta 21°C during development. Note the similar surface temperature (Ts) at 0 min, the different Ts after 30 min, the rapid fall of Ts on day 1, and the maintenance of a high Ts on day 15.
