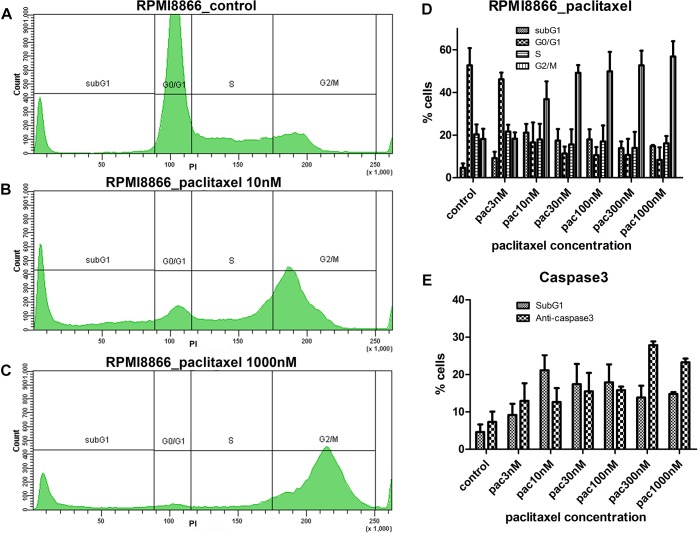
FIGURE 1.
RPMI8866 B-lymphocytes untreated (control) and treated with paclitaxel (concentration range 3, 10, 30, 100, 300, and 1000 nM) for 24 h. (A–C) DNA content curves in individual samples assessed by flow cytometry after propidium iodide staining and linear gates set to determine sub-G1, G0/G1, S, and G2/M cell cycle populations. 50 000 events were analyzed per sample. (A) Normal cell cycle distribution in control cells; G2/M comprises 19% cells, sub-G1 comprises 5% cells. (B) G2/M accumulation after 10 nM paclitaxel treatment; G2/M comprises 38% cells, sub-G1 comprises 25% cells. (C) G2/M accumulation after 1000 nM paclitaxel treatment; G2/M comprises 63% cells, sub-G1 comprises 15% cells. (D) Data from biological repeats on sub-G1, G0/G1, S, and G2/M population distributions were presented as mean percentages with SD on a histogram. Each measurement was performed at least in triplicate. (E) Miscorrelation of sub-G1 population numbers and caspase 3-positive cell numbers after paclitaxel treatment. The largest sub-G1 peak is observed at 10 nM paclitaxel while the largest caspase 3-positive population is observed at 300 nM paclitaxel.

